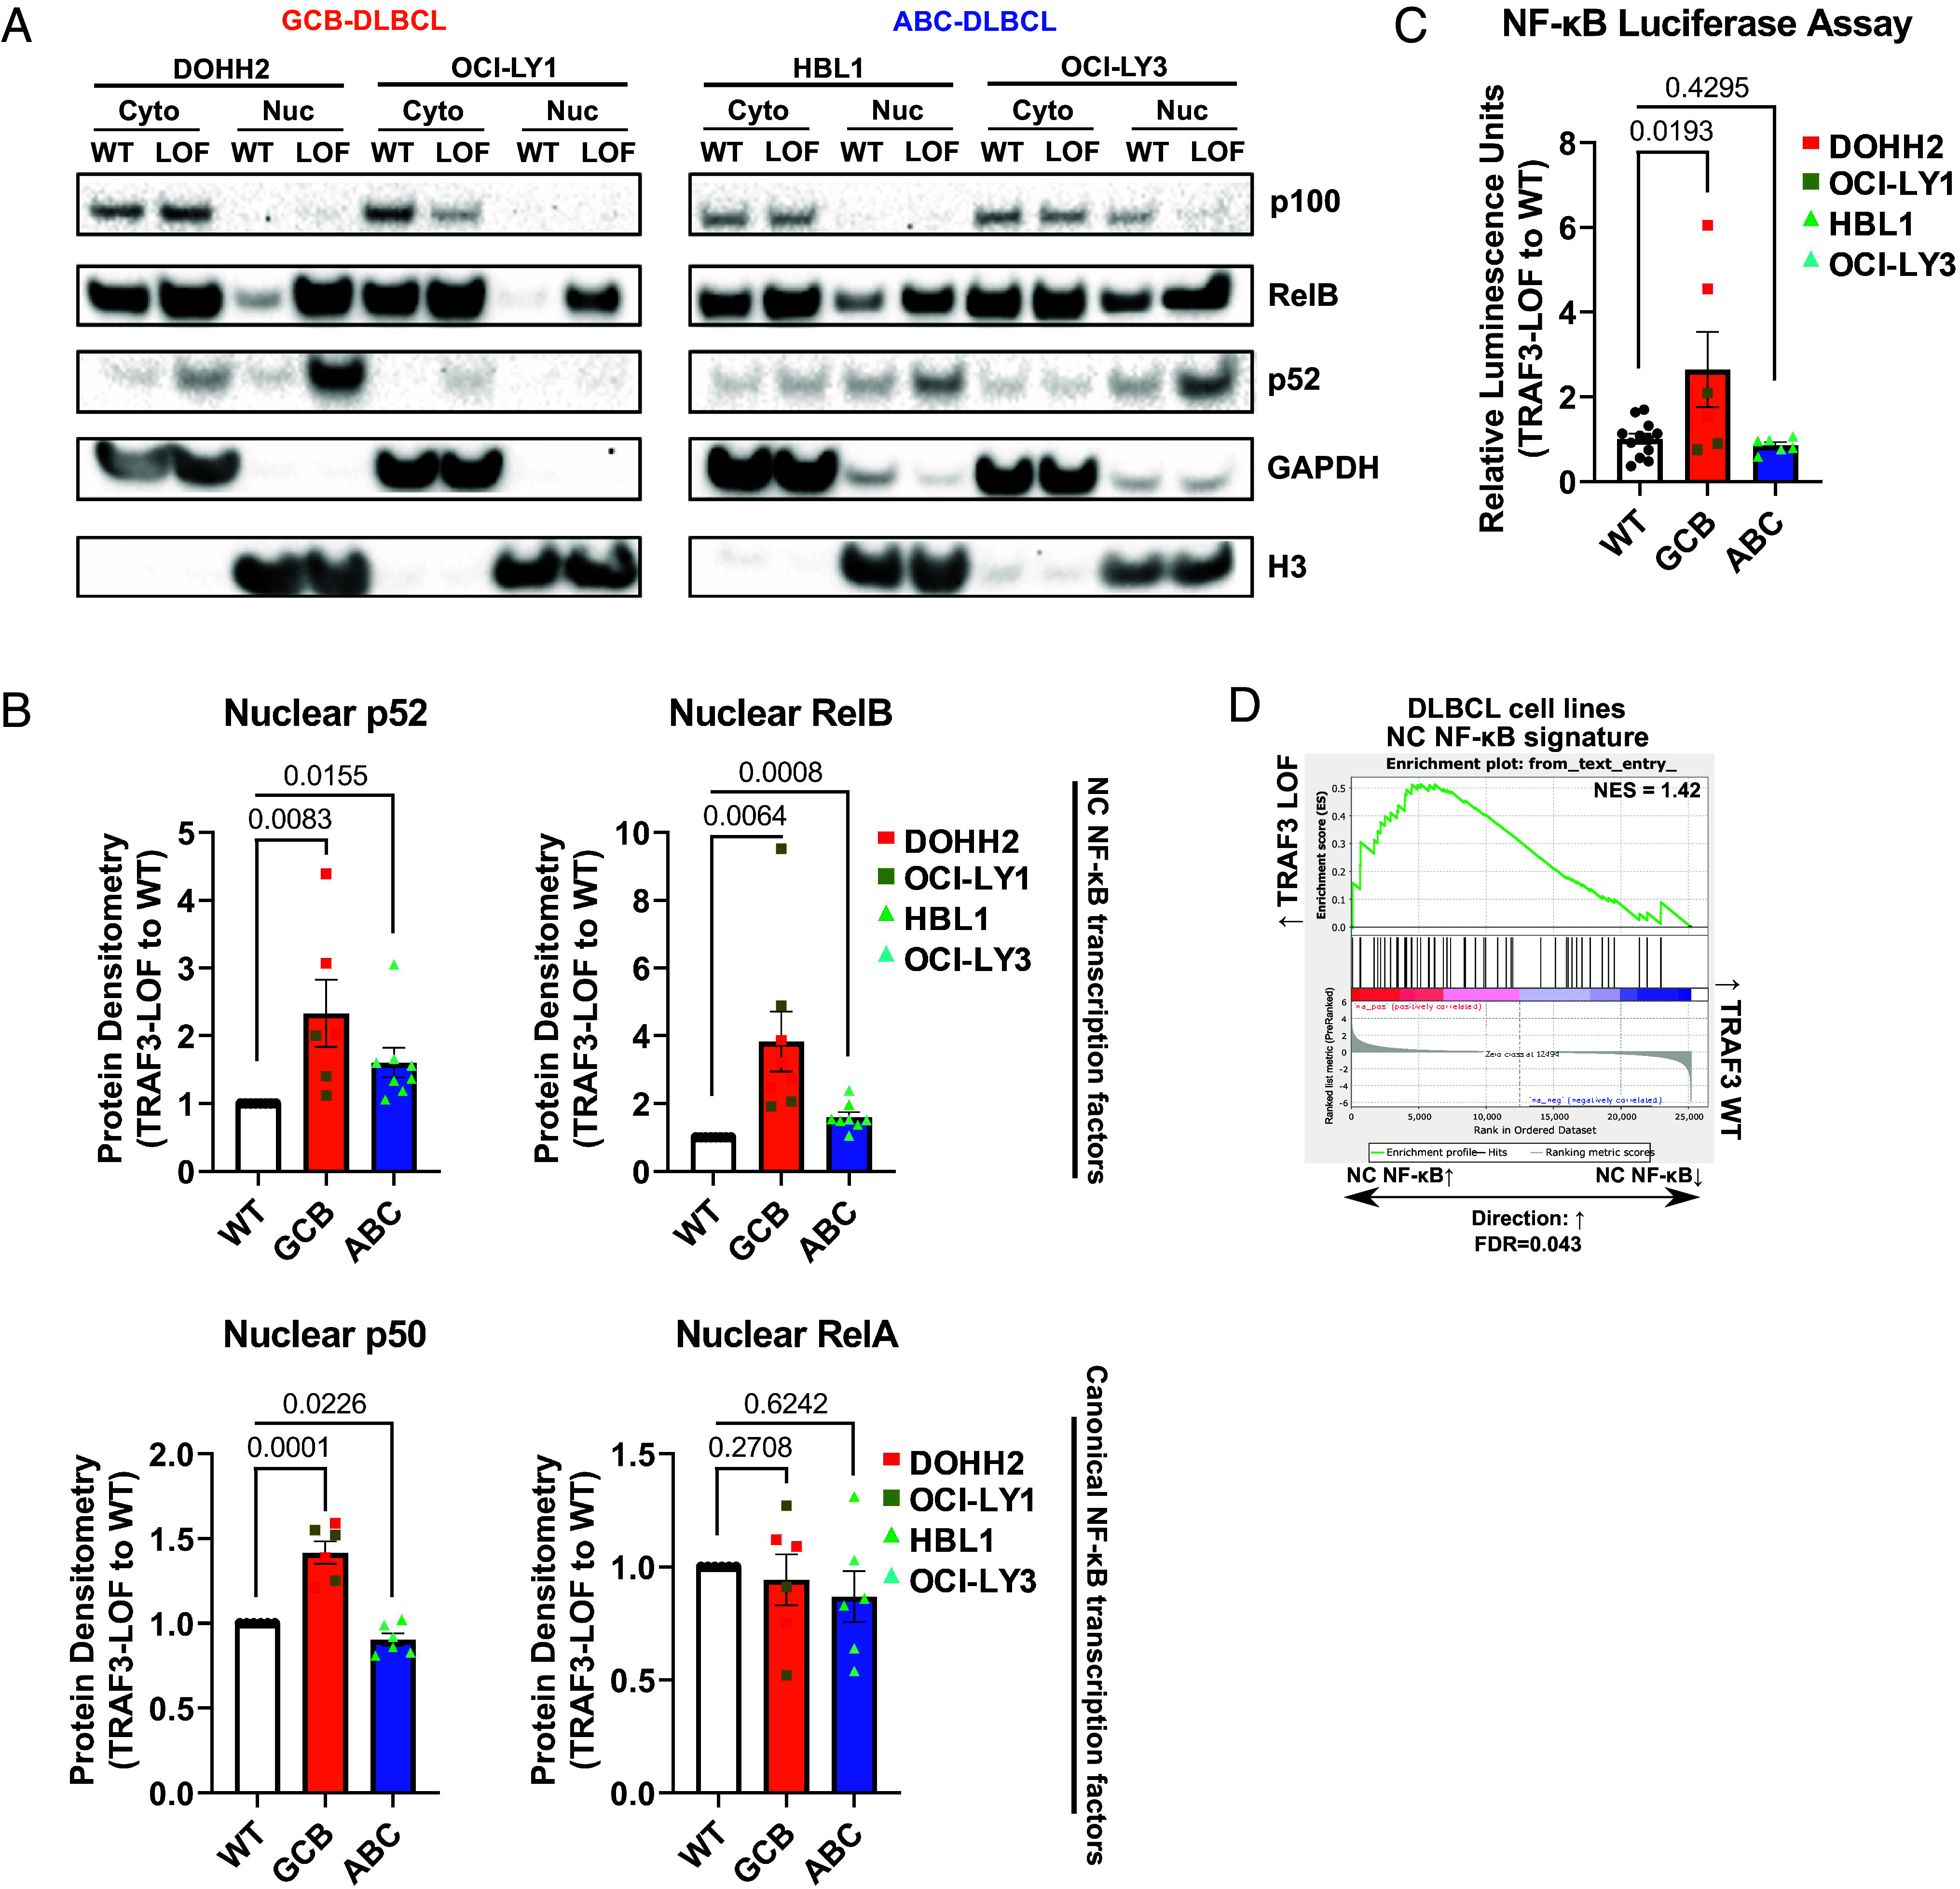
Fig. 2.

TRAF3 LOF enhances the NC NF-κB pathway in DLBCL. (A) Representative immunoblotting images of p100/p52 and RelB from TRAF3 WT and LOF DLBCL cell line models (DOHH2, OCI-LY1, HBL1, OCI-LY3). (B) Summaries of nuclear protein expression of p52, RelB, p50, and RelA. Band densities of TRAF3 LOF are compared to WT and normalized to Histone H3 (nuclear loading control) expression. (C) NF-κB luciferase reporter assays summarized as relative luminescence units of TRAF3 LOF to WT cells. (D) GSEA using the NC NF-κB expression signature in TRAF3 LOF vs. WT cell lines. For (B and C), each bar graph shows the mean values ± SEM, and each dot represents an independent replicate.
