Fig. 3.

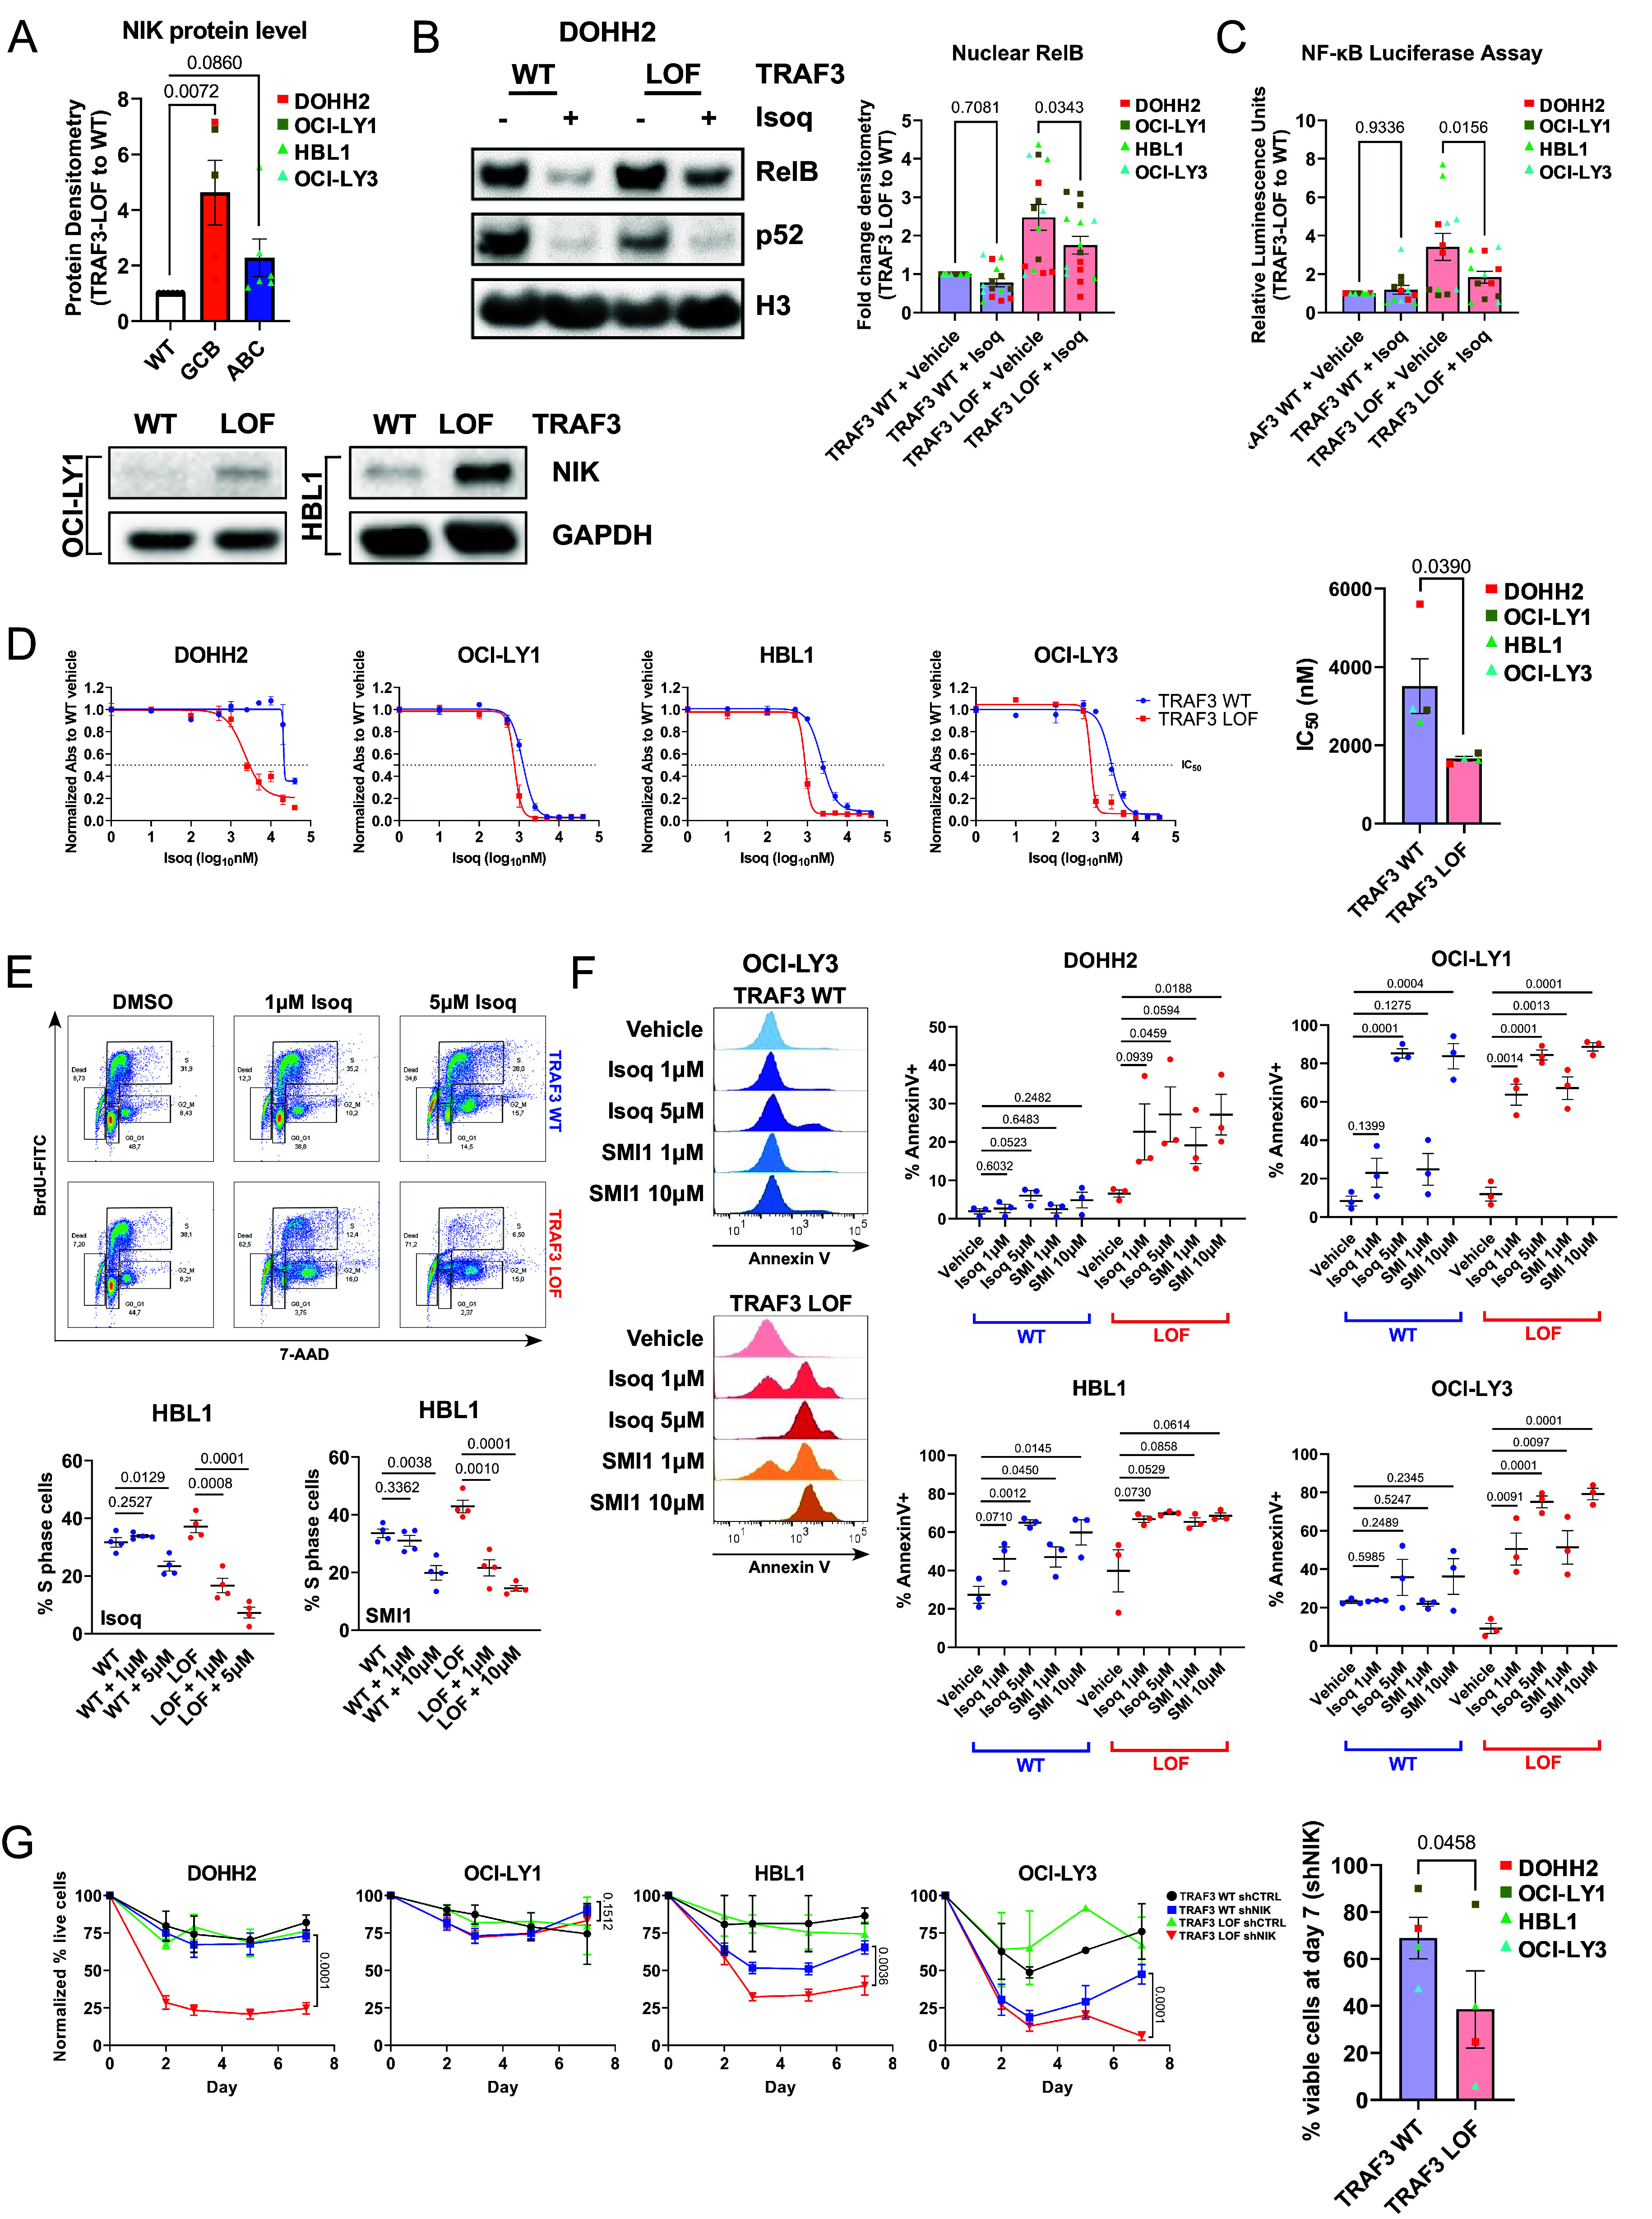
NIK is a critical player in NC NF-κB signaling in DLBCL. (A) NIK protein densitometry summary of TRAF3 WT and LOF whole-cell lysates. Band densities of each treatment condition are compared to TRAF3 WT and normalized to GAPDH (loading control) expression. Each dot represents an independent replicate. (B) Immunoblotting analysis of nuclear RelB and p52 expression in NIK inhibitor Isoq or vehicle control treated DOHH2 cells. Protein densitometry for RelB was normalized to GAPDH, prior to comparing each treatment condition to “TRAF3 WT + vehicle.” The full blot for DOHH2 is included in SI Appendix, Fig. S5A (excerpt from Top Left). (C) NF-κB luciferase reporter assays summarized as relative luminescence units of TRAF3 LOF to WT cells. (D) Dose–response analysis of the NIK inhibitor Isoq was performed using the WST-1 assay. Raw absorbance values were normalized to the “TRAF3 WT + vehicle” treatment. Each dot represents the average of independent replicates of each cell line. (E) BrdU/7-AAD flow cytometry staining and summary of percent gated S-phase events following Isoq or SMI1 treatment for HBL1. Shown above is the cell cycle gating strategy for G0_G1, S, G2_M, and dead cells. (F) AnnexinV flow cytometry staining was performed on DLBCL cells. Shown on the Left are representative histograms of Isoq or SMI1 treated OCI-LY3 TRAF3 WT and LOF cells, and summaries of DOHH2, OCI-LY1, HBL1, and OCI-LY3 are shown on the Right. (G) MAP3K14 (shNIK) knockdown in DLBCL cells. For (A–C and E–G), each dot represents the average of independent replicates of each cell line. For all panels, each graph shows the mean values ± SEM.
