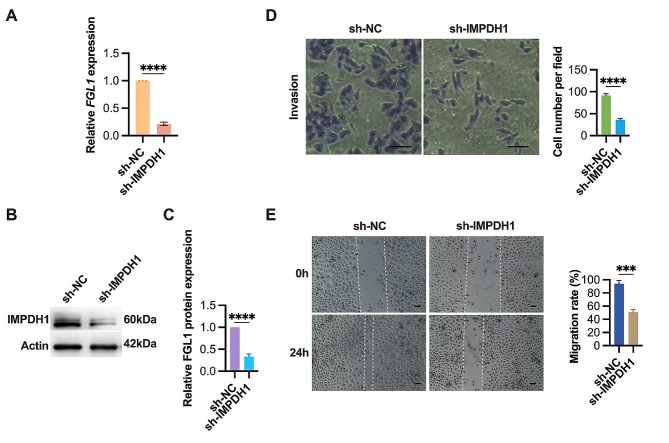
Fig. 5.
FGL1 drives invasion and migration through IMPDH1 in ESCC cells. (A-C) Quantification of IMPDH1 expression levels in FGL1-OE TE1 cells transfected with IMPDH1 shRNA (sh-IMPDH1) or random nonsense sequences (sh-NC) using qRT-PCR (A) and western blotting (B and C). β-Actin served as the loading control. (D) The effects of IMPDH1 knockdown on FGL1-OE TE1 cells invasion were evaluated by transwell invasion assay. Scale bars, 100 μm. (E) The effects of FGL1 knockdown on FGL1-OE TE1 cells migration were evaluated by wound healing assay. Scale bars, 100 μm. The statistical difference was assessed with the two-tailed unpaired Student t test in A, C, D and E. Error bars show the SD from three independent experiments. ***p < 0.001, ****p < 0.0001

