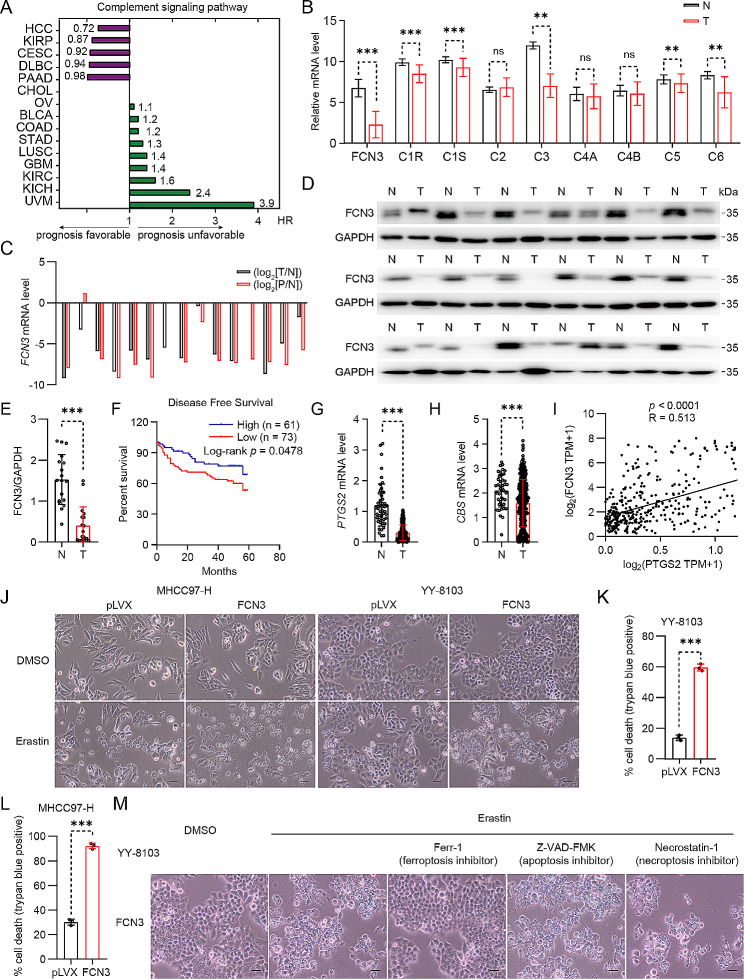
Fig. 1.
The reduced FCN3 level in HCC are associated with ferroptosis resistance
(A) The complement signaling pathway associated with prognosis (green represents unfavorable, purple represents favorable) in various tumors was analyzed by Kaplan–Meier analysis based on TCGA database. (KIRP: Kidney renal papillary cell carcinoma, CESC: Cervical squamous cell carcinoma, DLBC: Lymphoid Neoplasm Diffuse Large B-cell Lymphoma, PAAD: Pancreatic adenocarcinoma, CHOL: Cholangio carcinoma, OV: Ovarian serous cystadenocarcinoma, BLCA: Bladder Urothelial Carcinoma, COAD: Colon adenocarcinoma, STAD: Stomach adenocarcinoma, LUSC: Lung squamous cell carcinoma, GBM: Glioblastoma multiforme, KIRC: Kidney renal clear cell carcinoma, KICH: Kidney Chromophobe, UVM: Uveal Melanoma). (B) mRNA expression of complement-related genes in normal human liver tissues (N) and HCC tissues (T) in published data from TCGA database. (C) mRNA expression of FCN3 in 15 groups of HCC (T), PVTT (P) and paired adjacent nontumor (N) tissues. log2(T/N) value < 0 indicated that FCN3 expression was downregulated, while log2(T/N) value > 0 indicated that FCN3 expression was upregulated in HCC and PVTT samples. (D-E) Immunoblot (D) and quantification (E) of FCN3 in 18 pairs of HCC (T) and adjacent nontumor (N) tissues. GAPDH was used as a loading control. FCN3 exhibited two bands in human samples (two transcripts). (F) Kalpan–Meier analysis of disease-free survival of tissue microarray (TMA) data containing 134 patients. (G-H) mRNA expression of PTGS2 (G) and CBS (H) in normal human liver tissues (N) and HCC tissues (T) in data from TCGA database. (I) Correlation analysis of PTGS2 and FCN3 expressions based on TCGA database. (J) Representative images of FCN3-overexpressed YY-8103 and MHCC97-H cells treated with erastin. Scale bar, 100 μm. (K-L) Quantification of trypan blue staining for death cell in FCN3-overexpressed YY-8103 (K) and MHCC97-H (L) cells treated with erastin in (J). (M) FCN3-overexpressed YY-8103 cells were treated with erastin (10 µM) and specific cell death inhibitors. Scale bar, 100 μm
Data are from one representative experiment of three independent experiments (C-D and J-M). Data are presented as mean ± SD. Significance was assessed by Mann-Whitney U test (B, E, G, H), Log-rank test (F), Spearman correlation (I), Student’s t test (K, L). **p < 0.01, ***p < 0.001 compared with the control group

