Fig. 2.
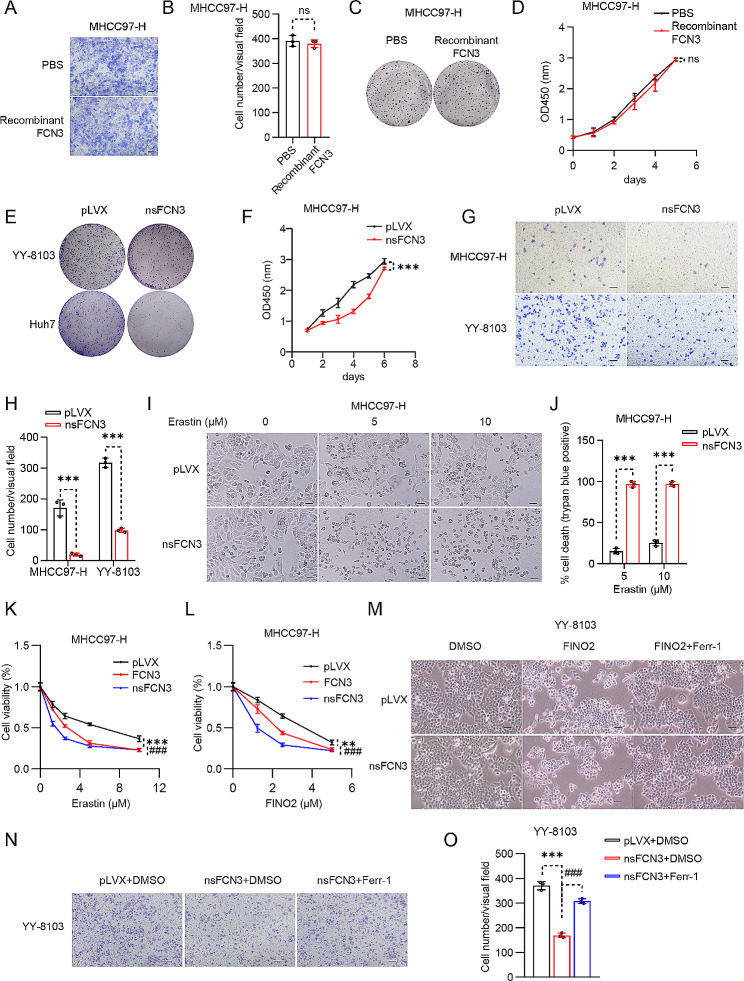
Intracellular FCN3 inhibits the migration and survival of HCC cells by promoting ferroptosis
(A-B) Representative images (A) and quantification (B) of migrating MHCC97-H cells after treatment with 300 ng/mL FCN3 recombinant protein. Scale bar, 100 μm. (C-D) Crystal violet (C) and CCK8 assay (D) in FCN3 recombinant protein treated MHCC97-H cells, the treatment medium was refreshed every three days, FCN3 recombinant protein: 300 ng/mL. (E) Representative images of the crystal violet assay in nsFCN3-overexpressed YY-8103 and Huh7 cells. (F) CCK8 assay in nsFCN3-overexpressed MHCC97-H cells. (G) Representative images of migrating MHCC97-H and YY-8103 cells that cultured in trans-well plates. Scale bar, 100 μm. (H) Quantification of the average number of migrating MHCC97-H and YY-8103 cells in (G). (I) Representative images of nsFCN3-overexpressed MHCC97-H cells treated with erastin. Scale bar, 100 μm. (J) Quantification of trypan blue staining for death cell in nsFCN3-overexpressed MHCC97-H cells treated with erastin. (K-L) Viability of FCN3- and nsFCN3-overexpressed MHCC97-H cells treated with indicated concentrations of erastin (K) or FINO2 (L) for 24 h. (M) Representative images of nsFCN3-overexpressed YY-8103 cells treated with FINO2 (10 µM) and Ferr-1 (2 µM). Scale bar, 100 μm. (N-O) Representative images (N) and quantification (O) of migrating YY-8103 cells treated with Ferr-1 (2 µM). Scale bar, 100 μm
Data are presented as mean ± SD and are from one representative experiment of three independent experiments. Significance was assessed by Student’s t test (B, H, J, O). **p < 0.01, ***, ###p < 0.001 compared with the control group. ns, not significant

