Fig. 3.
FCN3 inhibits the development of HCC in vivo
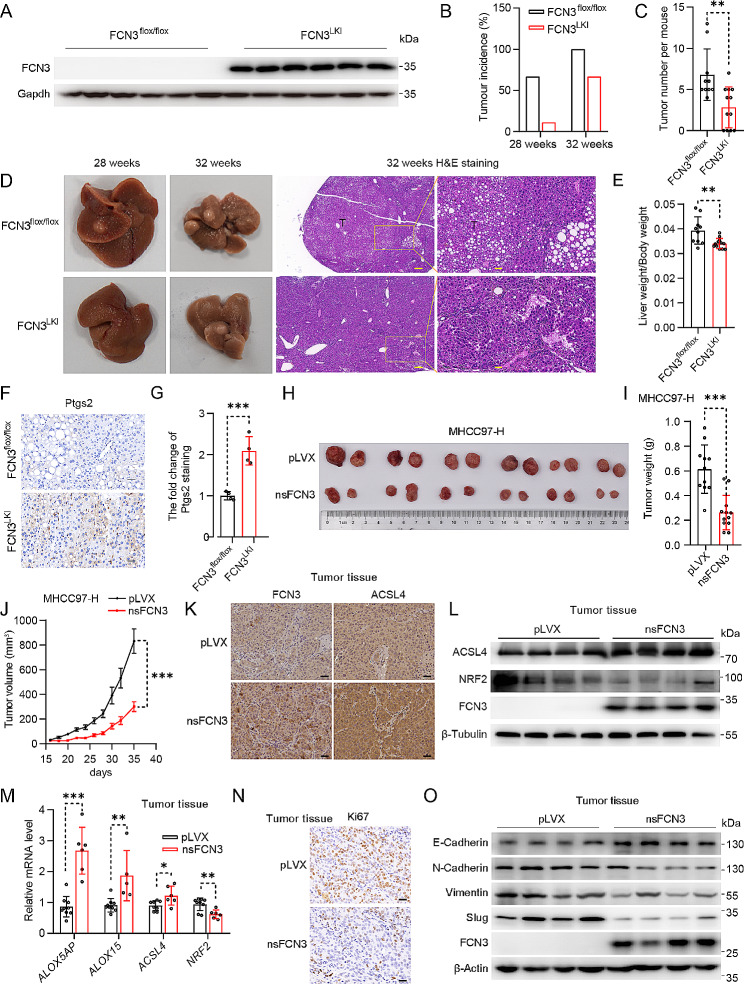
(A) Immunoblot of FCN3 in the liver of FCN3LKI and control mice. Gapdh was used as a loading control. (B) Tumor incidence from FCN3LKI and control mice inducted for 28 and 32 weeks. (C) Quantification of total surface tumors number from FCN3LKI and control mice inducted for 32 weeks. (D) Representative images of the livers and tumors from FCN3LKI and control mice inducted for 28 and 32 weeks. Scale bar, 200 μm & 40 μm. (E) Ratios of liver weight to body weight at week 32. (F) Representative images of Ptgs2 staining in mouse liver. Scale bar, 20 μm. (G) Quantification of Ptgs2 staining in (F). (H) Representative image of xenografts for nsFCN3-overexpressed and control MHCC97-H cells at day 36 (n = 6 mice per group). (I) Weights of xenograft tumors in (H) at day 36 (n = 12 per group). (J) A subcutaneous tumor volume curve from (H) (n = 6 mice per group). (K) Representative images of FCN3 and ACSL4 IHC staining in xenograft tumors. Scale bar, 40 μm. (L) Immunoblots of ACSL4 and NRF2 in xenograft tumors. β-Tubulin was used as a loading control. (M) mRNA levels of ferroptosis-related genes in xenograft tumors. (N) Representative images of Ki67 IHC staining in xenograft tumors. Scale bar, 20 μm. (O) Immunoblots of EMT-related proteins in xenograft tumors. β-Actin was used as a loading control
Data are presented as mean ± SD. Significance was assessed by Mann-Whitney U test (C), Student’s t test (E, G, I, M). *p < 0.05, **p < 0.01, ***p < 0.001 compared with the control group

