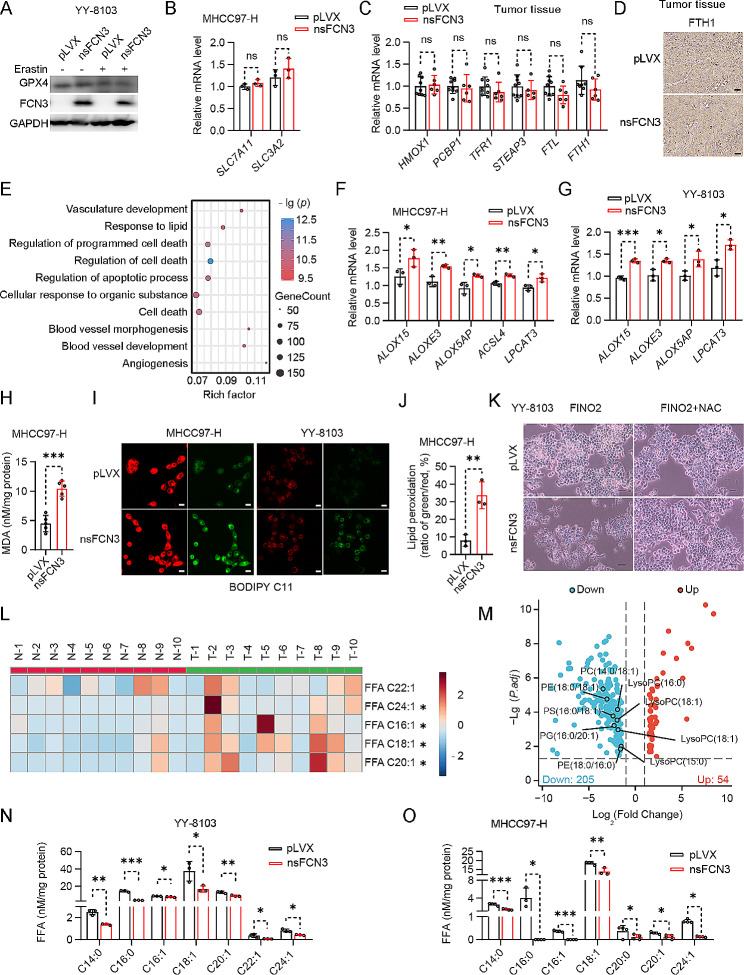
Fig. 4.
FCN3 promotes ferroptosis in HCC cells by reducing MUFA levels and enhancing lipid oxidation
(A) Immunoblot of GPX4 in nsFCN3-overexpressed YY-8103 cells treated with 10 µM erastin for 24 h. GAPDH was used as a loading control. (B) mRNA levels of SLC7A11 and SLC3A2 in nsFCN3-overexpressed MHCC97-H cells and control cells. (C) mRNA levels of iron metabolism-related genes in xenograft tumors derived from Fig. 3H. (D) Representative images of FTH1 IHC staining in xenograft tumors derived from Fig. 3H. Scale bar, 40 μm. (E) The diagram of GO enrichment based on the DEGs (|log2 Fold Change|>1, p value < 0.05) in nsFCN3-overexpressed and control MHCC97-H cells analyzed with RNA-seq (n = 3). (F-G) mRNA levels of lipid peroxidation-related genes in nsFCN3-overexpressed MHCC97-H (F) cells and YY-8103 (G) cells. (H) The content of MDA in nsFCN3-overexpressed and control MHCC97-H cells (n = 5). (I-J) Representative images (I) and quantification (J) of BODIPY-C11 stained nsFCN3-overexpressed MHCC97-H and YY-8103 cells treated with 10 µM erastin for 12 h. A shift in green-to-red ratio indicates lipid oxidation, Scale bar, 40 μm. (K) Representative images of nsFCN3-overexpressed YY-8103 cells treated with FINO2 (10 µM) and NAC (1 mM). Scale bar, 100 μm. (L) Heatmap analysis of MUFA in tumor tissues (T) compared to paired normal adjacent tissue (N). Red indicated increase, and blue indicated decrease. -2 ~ 2 indicated the Fold Change. (M) Volcano plot of metabolites in nsFCN3-overexpressed and control MHCC97-H cells. LC-MS-based nontargeted metabolomic analysis, and the data was corrected by total peak area. (N-O) Fatty acid levels in YY-8103 (N) and MHCC97-H (O) cells overexpressing nsFCN3
Data are from one representative experiment of three independent experiments (F-G). Data are presented as mean ± SD. Significance was assessed by Student’s t test (B, C, F, G, H, J), Mann-Whitney U test (N, O). *p < 0.05, **p < 0.01, ***p < 0.001 compared with the control group. ns, not significant

