Fig. 5.
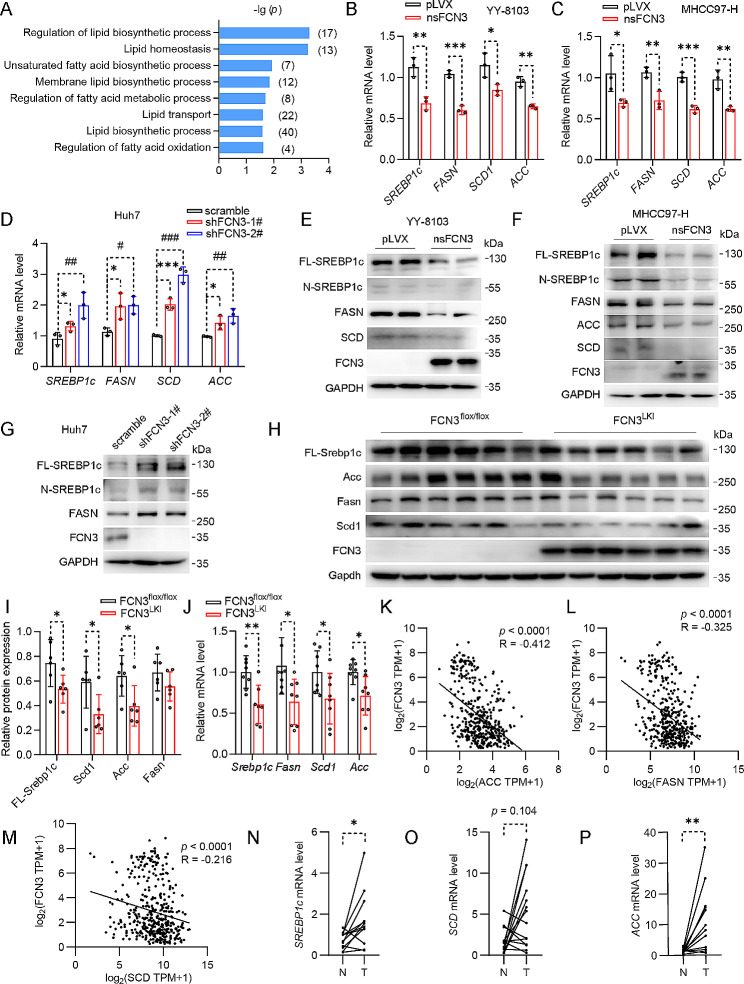
FCN3 inhibits MUFA synthesis by downregulating SREBP1c expression
(A) Enrichment of lipid metabolism related biological processes based on the GO enrichment in Fig. 4E. (B-C) mRNA levels of lipogenic genes in nsFCN3-overexpressed YY-8103 (B) and MHCC97-H (C) cells. (D) mRNA levels of lipogenic genes in FCN3-knockdown and control Huh7 cells. (E-F) Immunoblots of lipogenic proteins in nsFCN3-overexpressed YY-8103 (E) and MHCC97-H (F) cells. GAPDH was used as a loading control. (G) Immunoblots of lipogenic proteins in FCN3-knockdown and control Huh7 cells. GAPDH was used as a loading control. (H-I) Immunoblots (H) and quantification (I) of lipogenic proteins in the liver tissues of FCN3LKI and control mice. GAPDH was used as a loading control. (J) mRNA levels of lipogenic genes in the liver tissues of FCN3LKI and control mice. (K-M) Correlation analysis of ACC (K), FASN (L), SCD (M) and FCN3 expressions based on TCGA database. (N-P) mRNA levels of SREBP1c (N), SCD (O) and ACC (P) in 15 paired adjacent and tumor tissues.
Data are from one representative experiment of three independent experiments (B-G). Data are presented as mean ± SD. Significance was assessed by Student’s t test (B, C, I, J), one-way ANOVA (D), Spearman correlation (K, L, M), paired Student’s t test (N, P), Wilcoxon matched-pairs signed rank test (O). *, #p < 0.05, **, ##p < 0.01, ***, ###p < 0.001 compared with the control group

