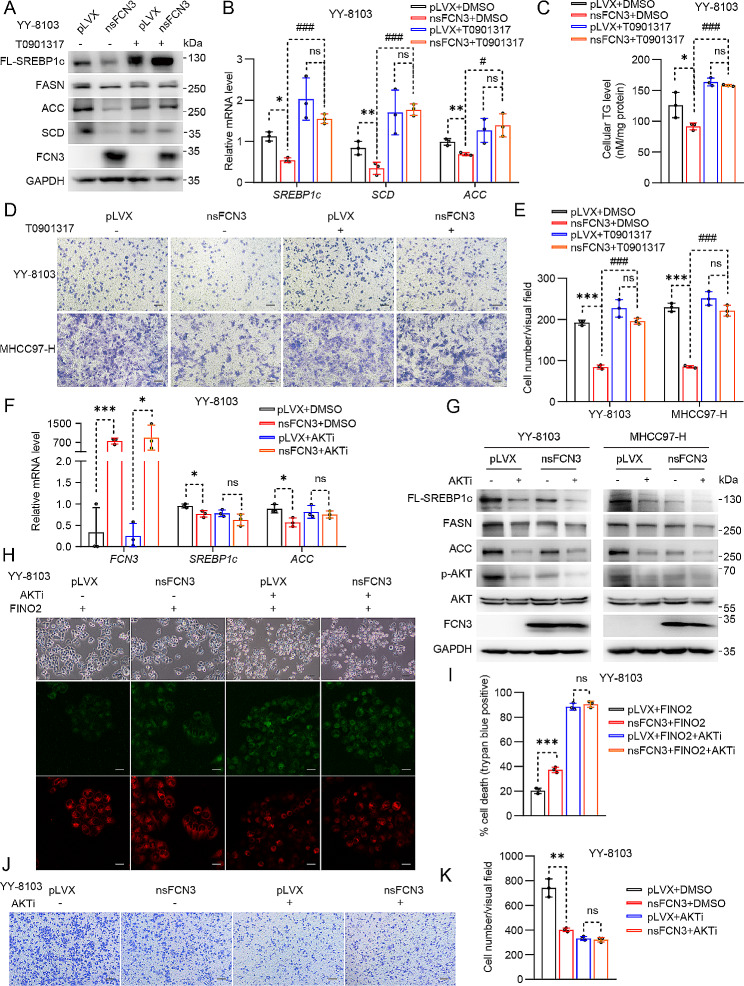
Fig. 6.
FCN3 suppresses HCC by inhibiting the AKT/SREBP axis
(A) Immunoblots of DNL-related proteins in nsFCN3-overexpressed YY-8103 cells treated with T0901317 (10 µM) for 24 h. GAPDH was used as a loading control. (B) mRNA levels of lipogenic genes in nsFCN3-overexpressed and control YY-8103 cells treated with T0901317 (10 µM) for 24 h. (C) TG contents in nsFCN3-overexpressed YY-8103 cells treated with T0901317 (10 µM) and palmitic acid (PA, 100 µM). (D) Representative images of indicated cells that cultured in trans-well plates. Scale bar, 100 μm. (E) Quantification of the average number of migrating YY-8103 and MHCC97-H cells in (D). (F) mRNA levels of lipogenic genes in nsFCN3-overexpressed YY-8103 cells treated with AKTi (10 µM) for 24 h. (G) Immunoblots of lipogenic proteins and p-AKT in nsFCN3-overexpressed YY-8103 and MHCC97-H cells treated with AKTi (10 µM) for 24 h. GAPDH was used as a loading control. (H) Representative images of nsFCN3-overexpressed YY-8103 cells treated with FINO2 (5 µM) and AKTi (10 µM). Scale bar, 100 μm. (I) Quantification of trypan blue staining for death cell in (H). (J) Representative images of indicated cells that cultured in trans-well plates. Scale bar, 100 μm. (K) Quantification of the average number of migrating YY-8103 cells in (J)
Data are presented as mean ± SD and are from one representative experiment of three independent experiments. Significance was assessed by Student’s t test (B, C, E, F, I, K). *, #p < 0.05, **, ##p < 0.01, ***, ###p < 0.001 compared with the control group. ns, not significant

