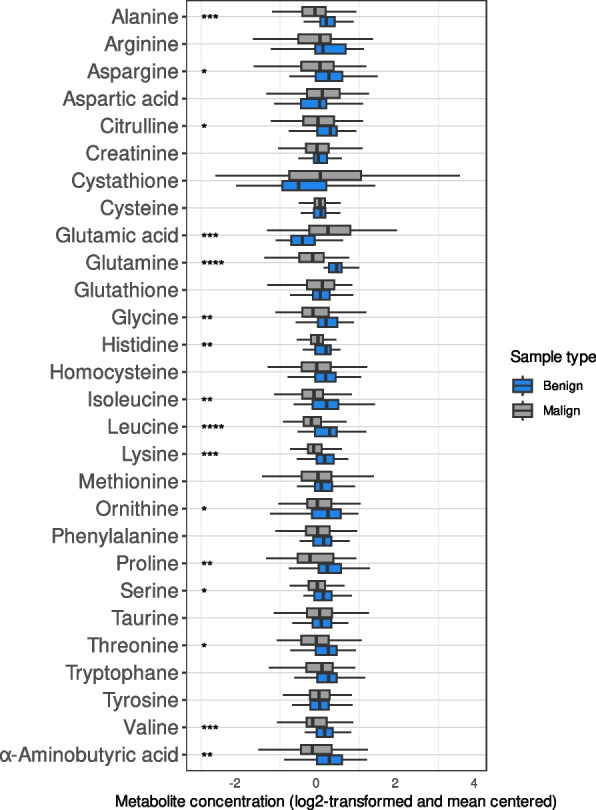
Fig. 2.

Boxplot illustrating the difference in metabolite profiles between samples from patients with benign pancreatic disease (blue, N = 45) and patients with periampullary malignancy (grey, N = 72; including 6 patients with neoadjuvant treatment). On the x-axis, the metabolite concentration (log2-transformed and mean centered). Wilcoxon’s Rank Sum Test was used to calculate the p-values. Multiple testing was performed by the Benjamini-Hochberg method (FDR). Significant difference in expression between the malignant and benign group for each metabolite is marked with stars; *: FDR < = 0.05, **: FDR < = 0.01, ***: FDR < = 0.001, ****: FDR < = 0.0001
