Fig. 1.

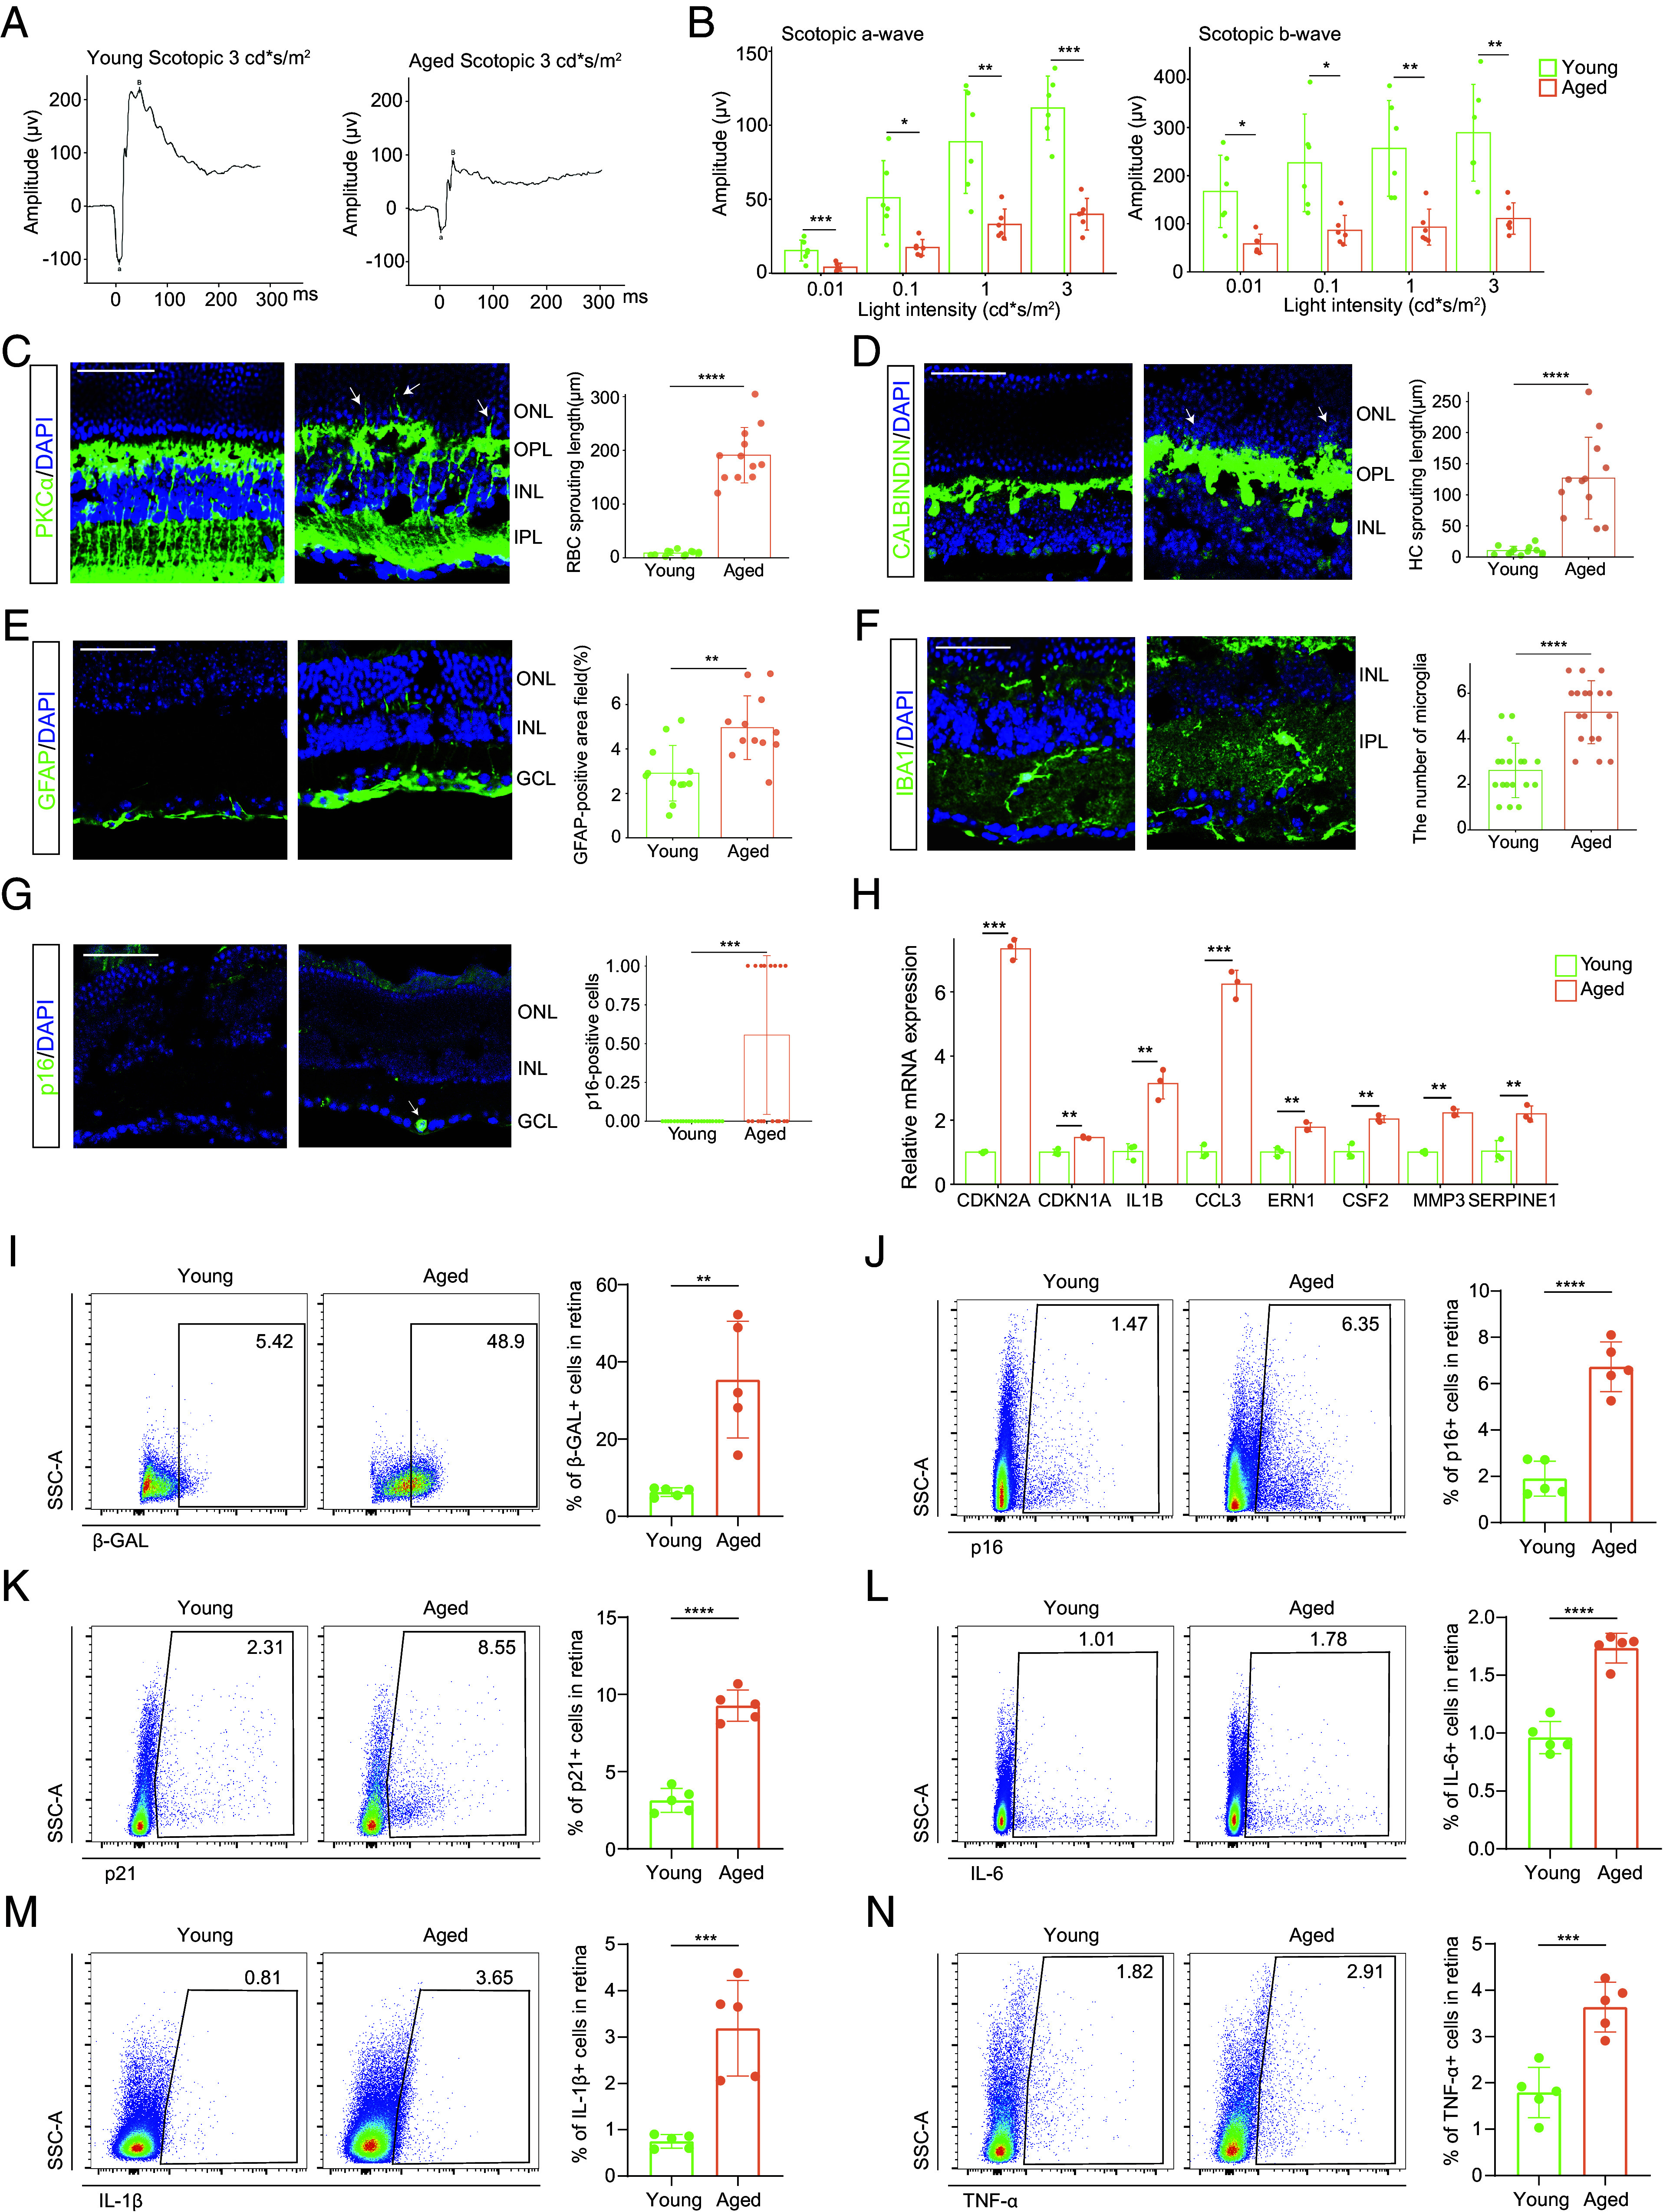
The age-related decline in the retina accompanied by senescence burden accumulation. (A) Representative scotopic ERG of young and aged mice at a light density of 3 cd*s/m2. (B) Bar charts showing the quantification of scotopic ERG amplitudes (n = 6/group). (C–G) Representative confocal images of retinal frozen sections of young (Left) and aged (Middle) mice and bar charts of quantification (Right, n = 6/group). Frozen sections are labeled with PKCα (C), Calbindin (D), GFAP (E), IBA1 (F), and p16 (G). Arrows indicate the abnormal sprouting dendrites of RBCs (C) and HCs (D) which extend beyond OPL into the ONL. The arrow in (G) indicates the p16+ cell in the retina. (Scale bar, 50 μm.) (H) The mRNA levels of several SASP-related genes were detected by RT-qPCR between young and old groups (n = 3/group). (I–N) The FC histograms (Left) and column charts (Right) showing the level of β-GAL (I), p16 (J), p21 (K), IL-6 (L), IL-1β (M), and TNF-α (N) in retinal cells between young and aged groups (n = 5/group). Data are shown as mean ± SD. P values were analyzed using unpaired two-tailed Student’s t test (B–E and H–N) or two-tailed Mann–Whitney U test (F and G); *P < 0.05, **P < 0.01, ***P < 0.001, and ****P < 0.0001.
