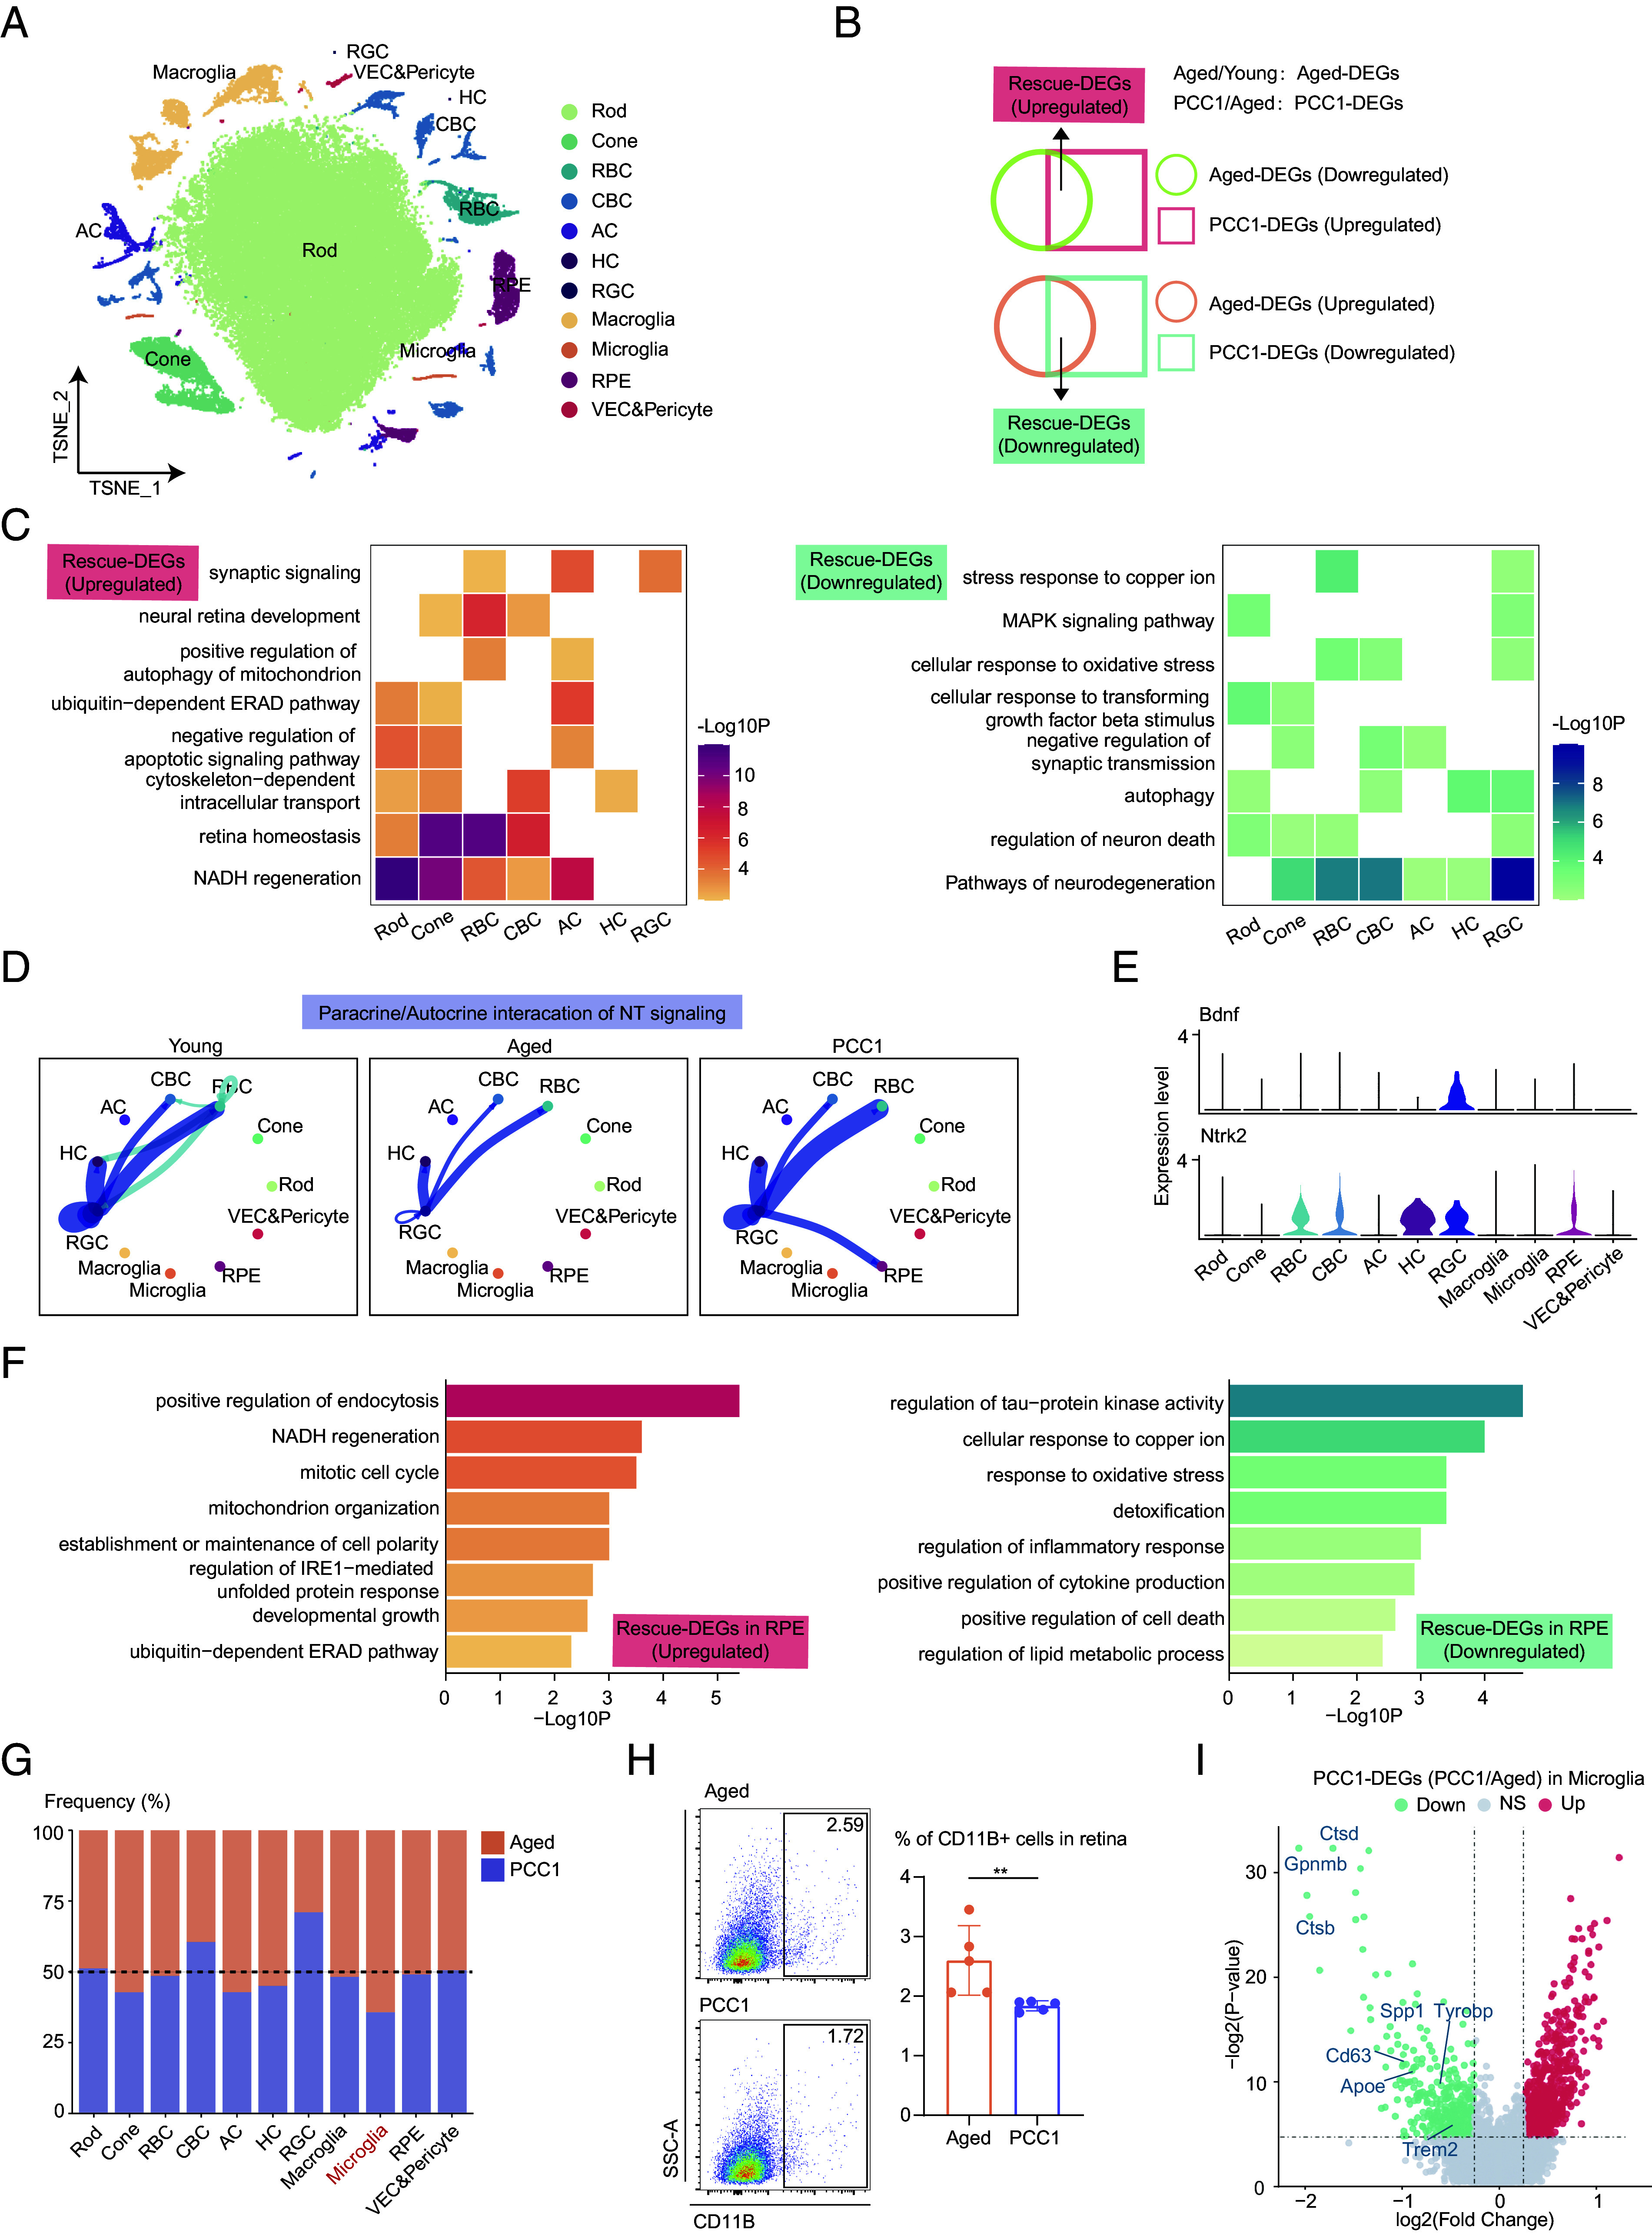
Fig. 3.

The seotherapeutic effects of PCC1 treatment on the aged retina evaluated by single-cell analysis. (A) t-SNE plot showing the distribution of different retinal cell types. (B) Venn diagrams showing the Aged-DEGs, PCC1-DEGs, and Rescue-DEGs. (C) Heatmaps showing GO terms enriched for the up-regulated (Left) and down-regulated (Right) Rescue-DEGs of different neuronal cell types after PCC1 treatment. (D) Circle plots showing the inferred NT signaling networks among three groups. Edge width represents the communication probability. (E) Violin plots showing the expression of the ligand–receptor involved in the inferred NT signaling pathway. (F) Bar plots showing the GO terms enriched for the up-regulated (Left) and down-regulated (Right) Rescue-DEGs of RPE after PCC1 treatment. (G) Bar plot showing the ratios of different retinal cell types of PCC1-treated mice compared to aged mice derived from scRNA-seq data. (H) Representative flow charts (Left) and quantification (Right) of the proportion of microglia from the retina of control and PCC1 group (n = 5/group). Data are shown as mean ± SD and were analyzed using unpaired two-tailed Student’s t test; **P < 0.01. (I) Volcano plot showing up-regulated and down-regulated PCC1-DEGs of microglia.
