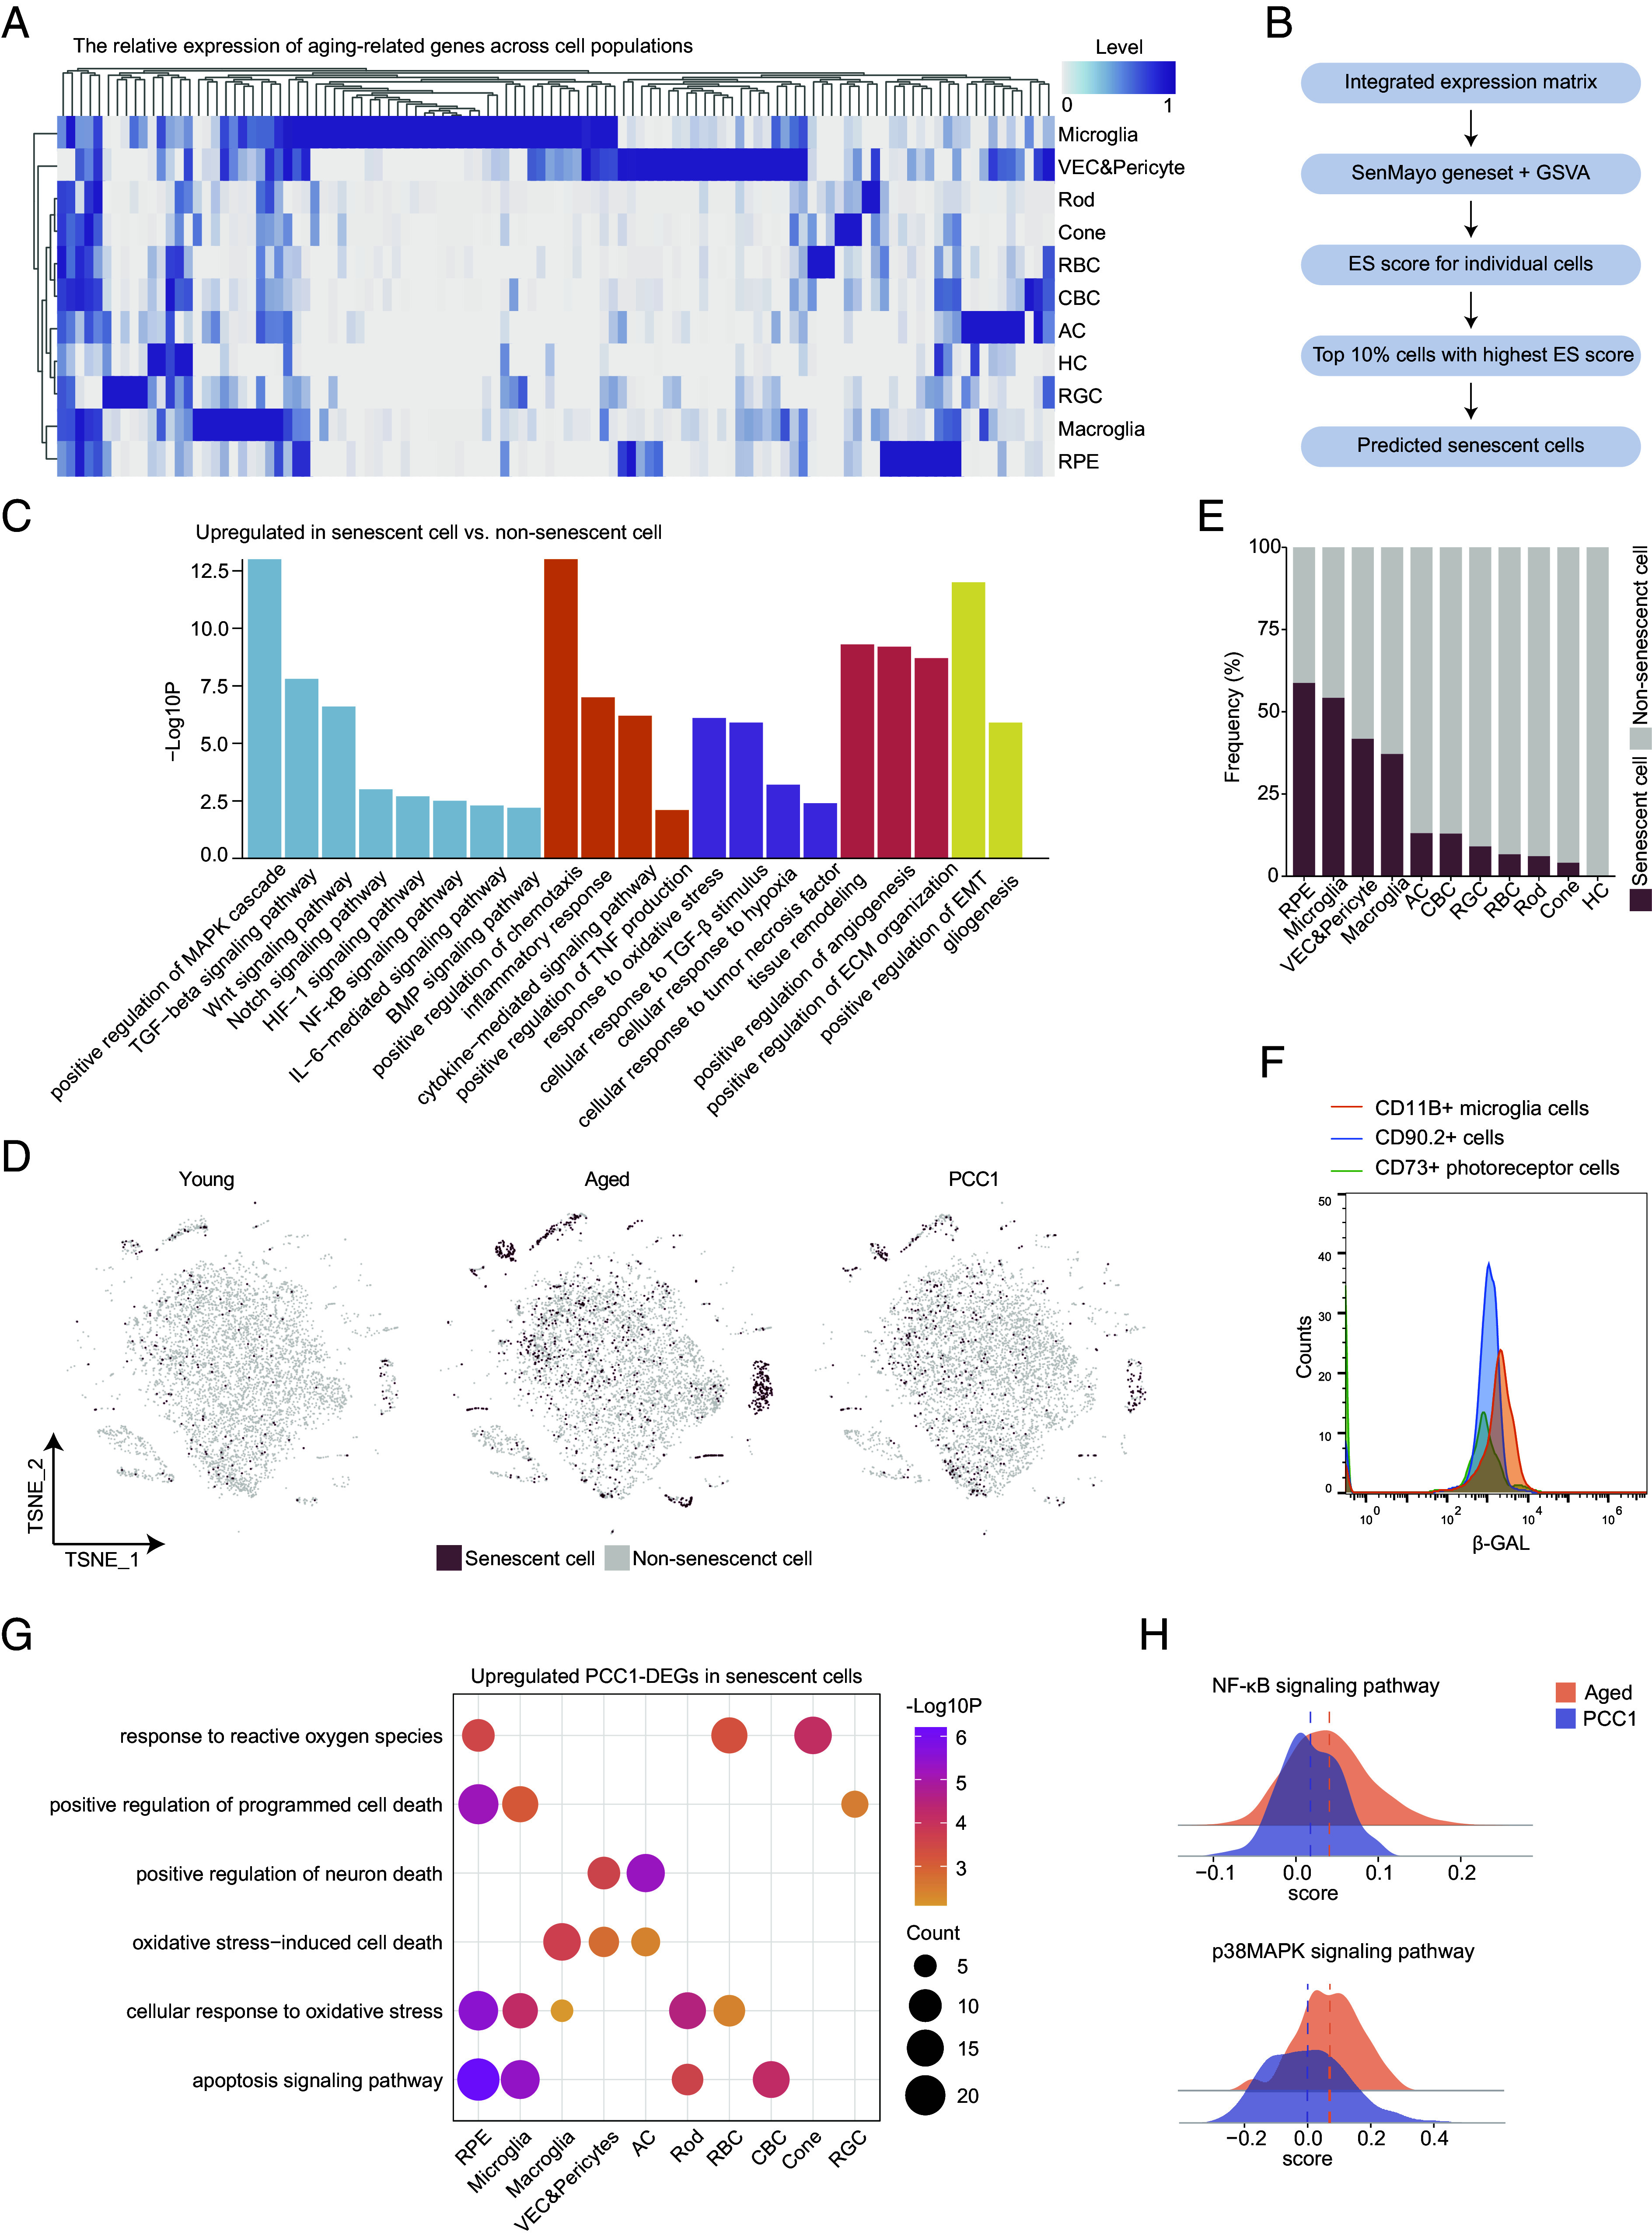
Fig. 4.

Clearance of inferred SnC and amelioration of SASP signatures by PCC1 in scRNA-seq data. (A) Heatmap showing the expression pattern of SASP-related genes in different cell types in the retina. (B) Schematic diagram showing predication of SnC in scRNA-seq data. (C) Bar plots showing the GO terms enriched for the up-regulated DEGs of SnC compared to non-SnC in the retina. Similar GO terms are placed together in the same color. (D) t-SNE plots showing the distribution of SnC in the retina of three groups. (E) Bar plot showing the percentage of SnC in all retinal cells of three groups. (F) FC overlay histogram showing the expression of β-gal of CD11B+ microglia cells (orange), CD90.2+ cells (blue), and CD73+ rods (green). Fluorescence intensity is represented on the x-axis and count of the events on the y-axis. (G) Dot plot showing pathways enriched for the up-regulated PCC1-DEGs in SnC of different retinal cell types from the retina. The color key indicates the P value. The dot size is proportional to the number of genes enriched in indicated pathways. (H) Ridge plots showing the gene set scores of NF-κB and p38MAPK signaling pathways of SnC from the aged and PCC1 groups.
