
Fig. 5.
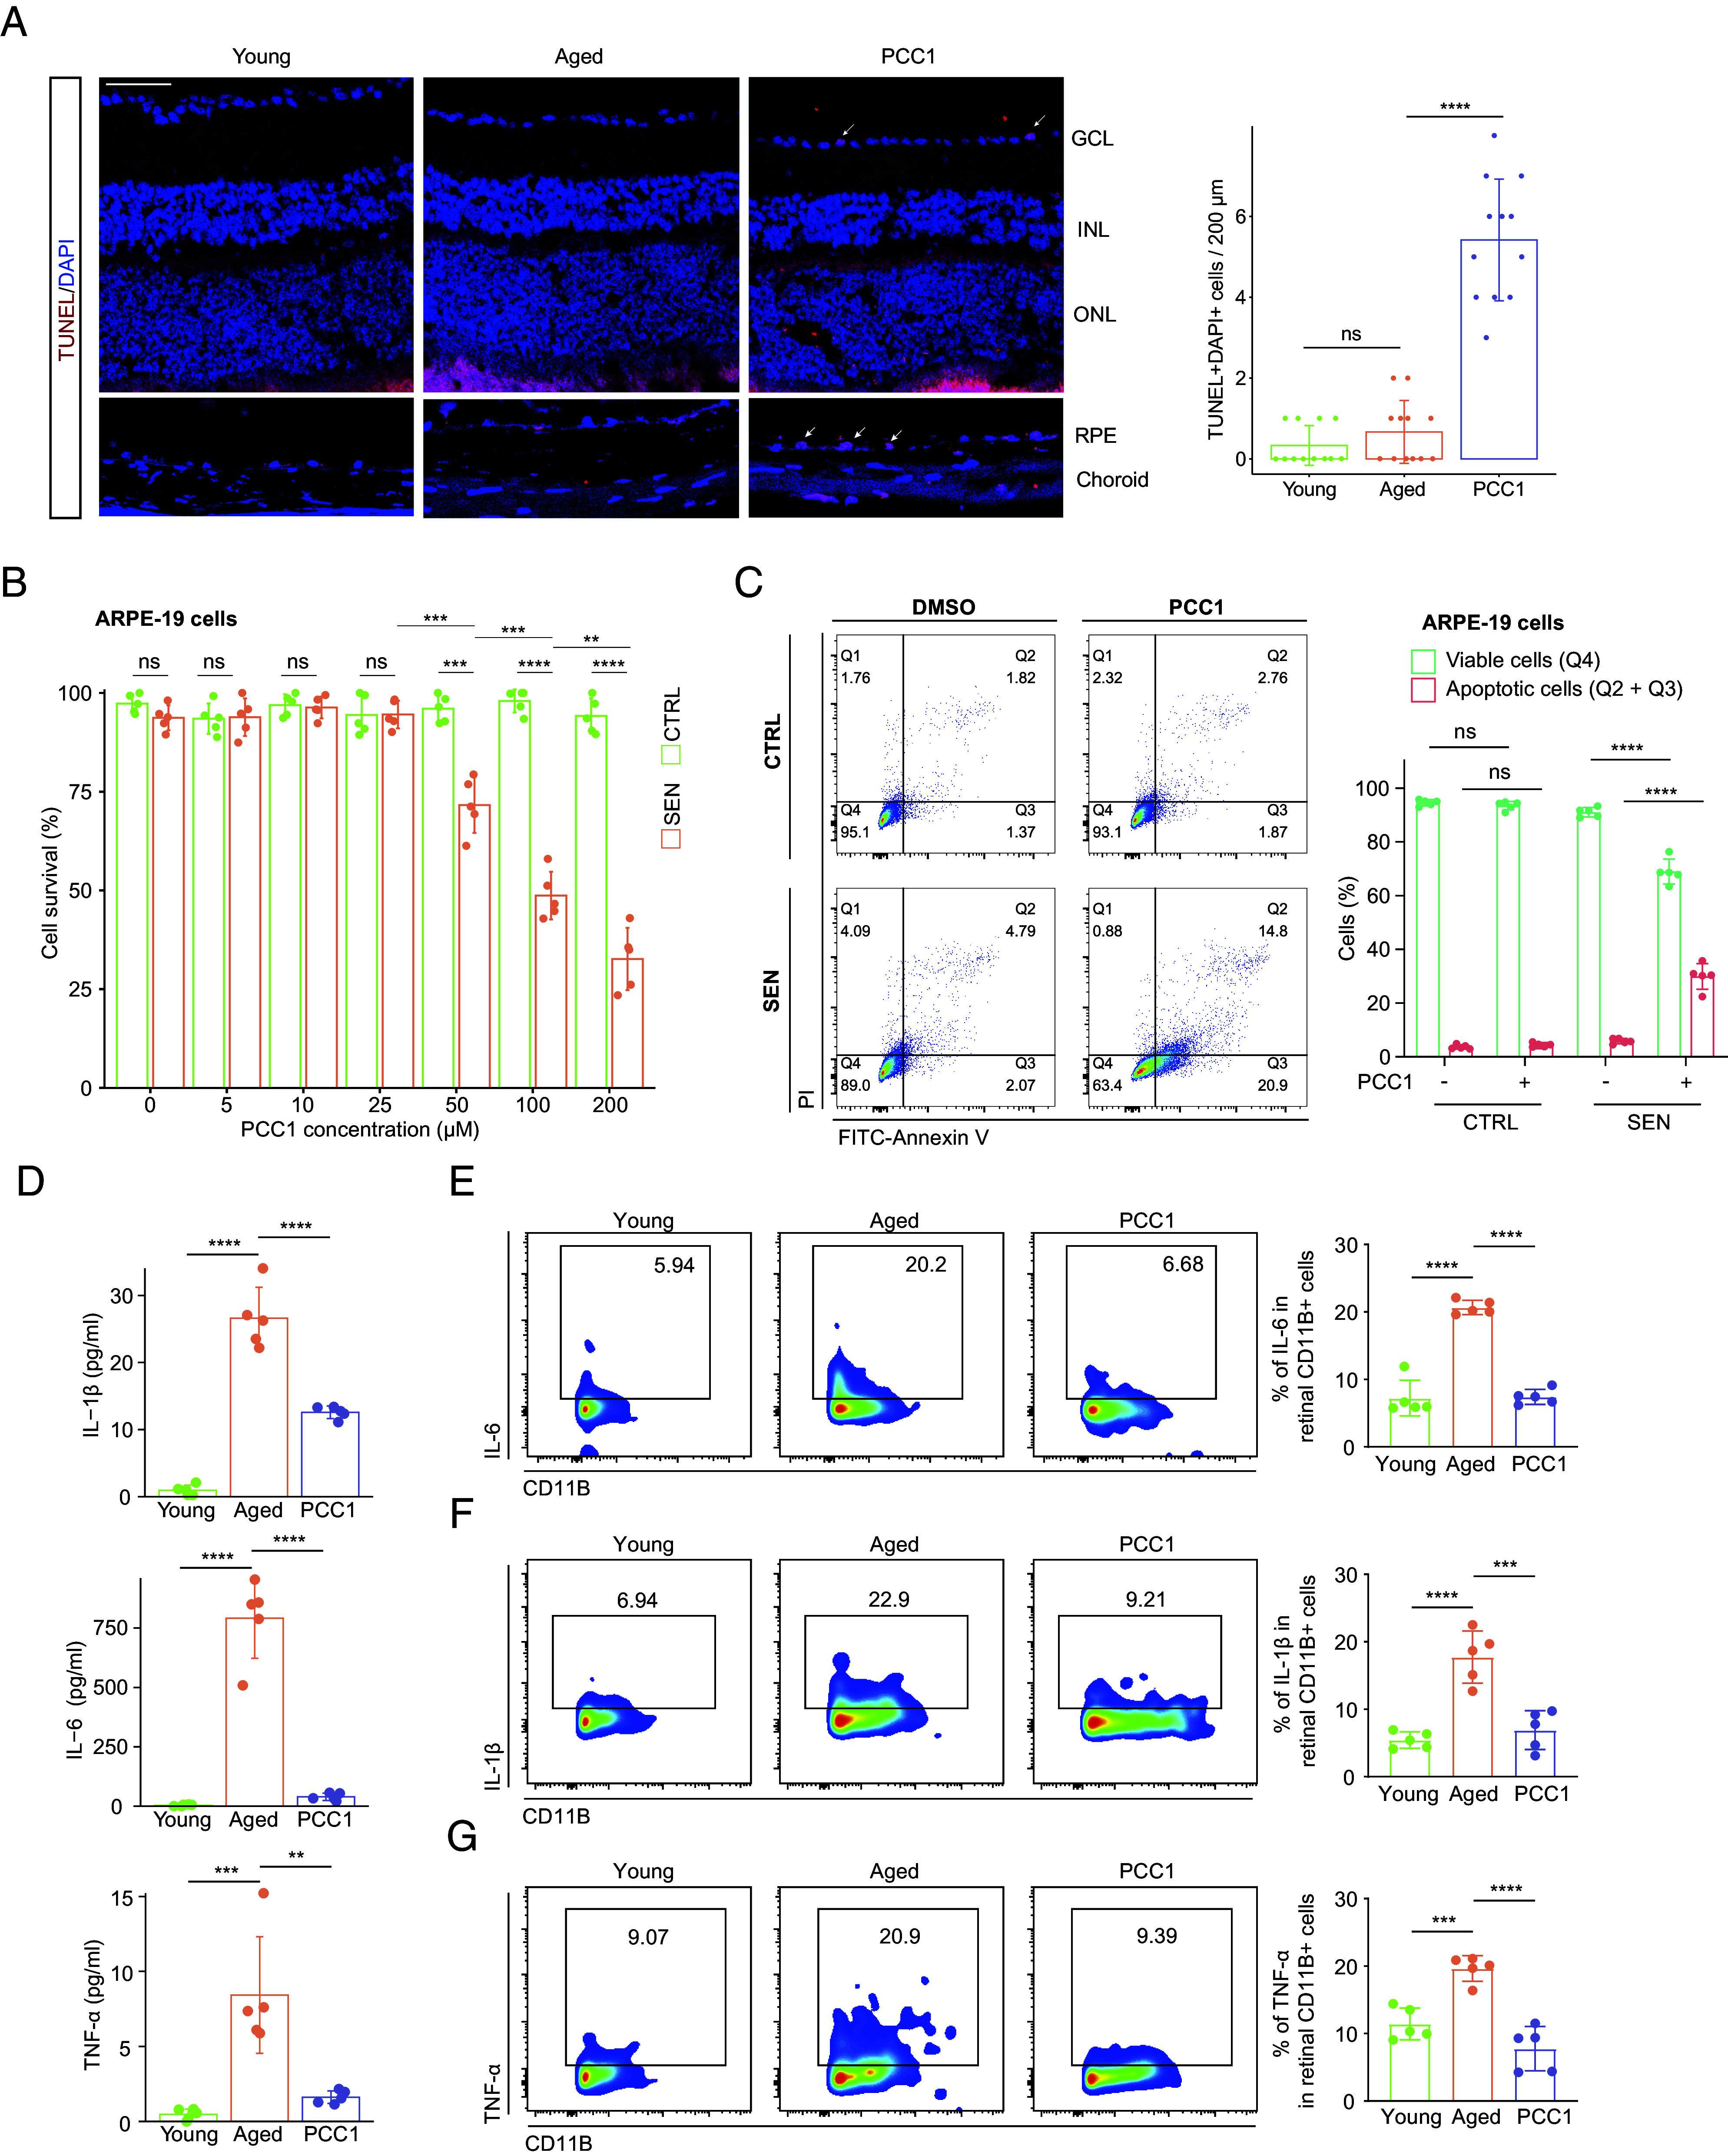
PCC1 demonstrated senolytic and senomorphic effects both in vivo and in vitro. (A) Representative confocal images of retinal frozen sections stained with the TUNEL assay among three groups and bar charts of quantification (n = 6/group). Arrows indicate the representative apoptotic cells. (Scale bar, 50 µm.) (B) Bar plot showing the CCK-8 assay on control and SnC of ARPE-19 cell line upon treatment of PCC1 (n = 5/group). (C) Representative flow charts (Left) and quantification (Right) of the annexin V/PI apoptotic assay on control and SnC of ARPE-19 cell line upon treatment of PCC1 (n = 5/group). (D) The plasma levels of IL-6, IL-1β, and TNF-α in different groups were measured by the ELISA assay (n = 5/group). (E–G) The FC histograms (Left) and column charts (Right) showing the level of IL-6 (E), IL-1β (F), and TNF-α (G) in retinal microglia among three groups (n = 5/group). Data are shown as mean ± SD. P values were analyzed using the Kruskal–Wallis test with Bonferroni post hoc test (A) or two-tailed unpaired Student’s t test (B and C) or one-way ANOVA with Bonferroni post hoc test (D–G); ns, nonsignificant, *P < 0.05, **P < 0.01, ***P < 0.001, and ****P < 0.0001.