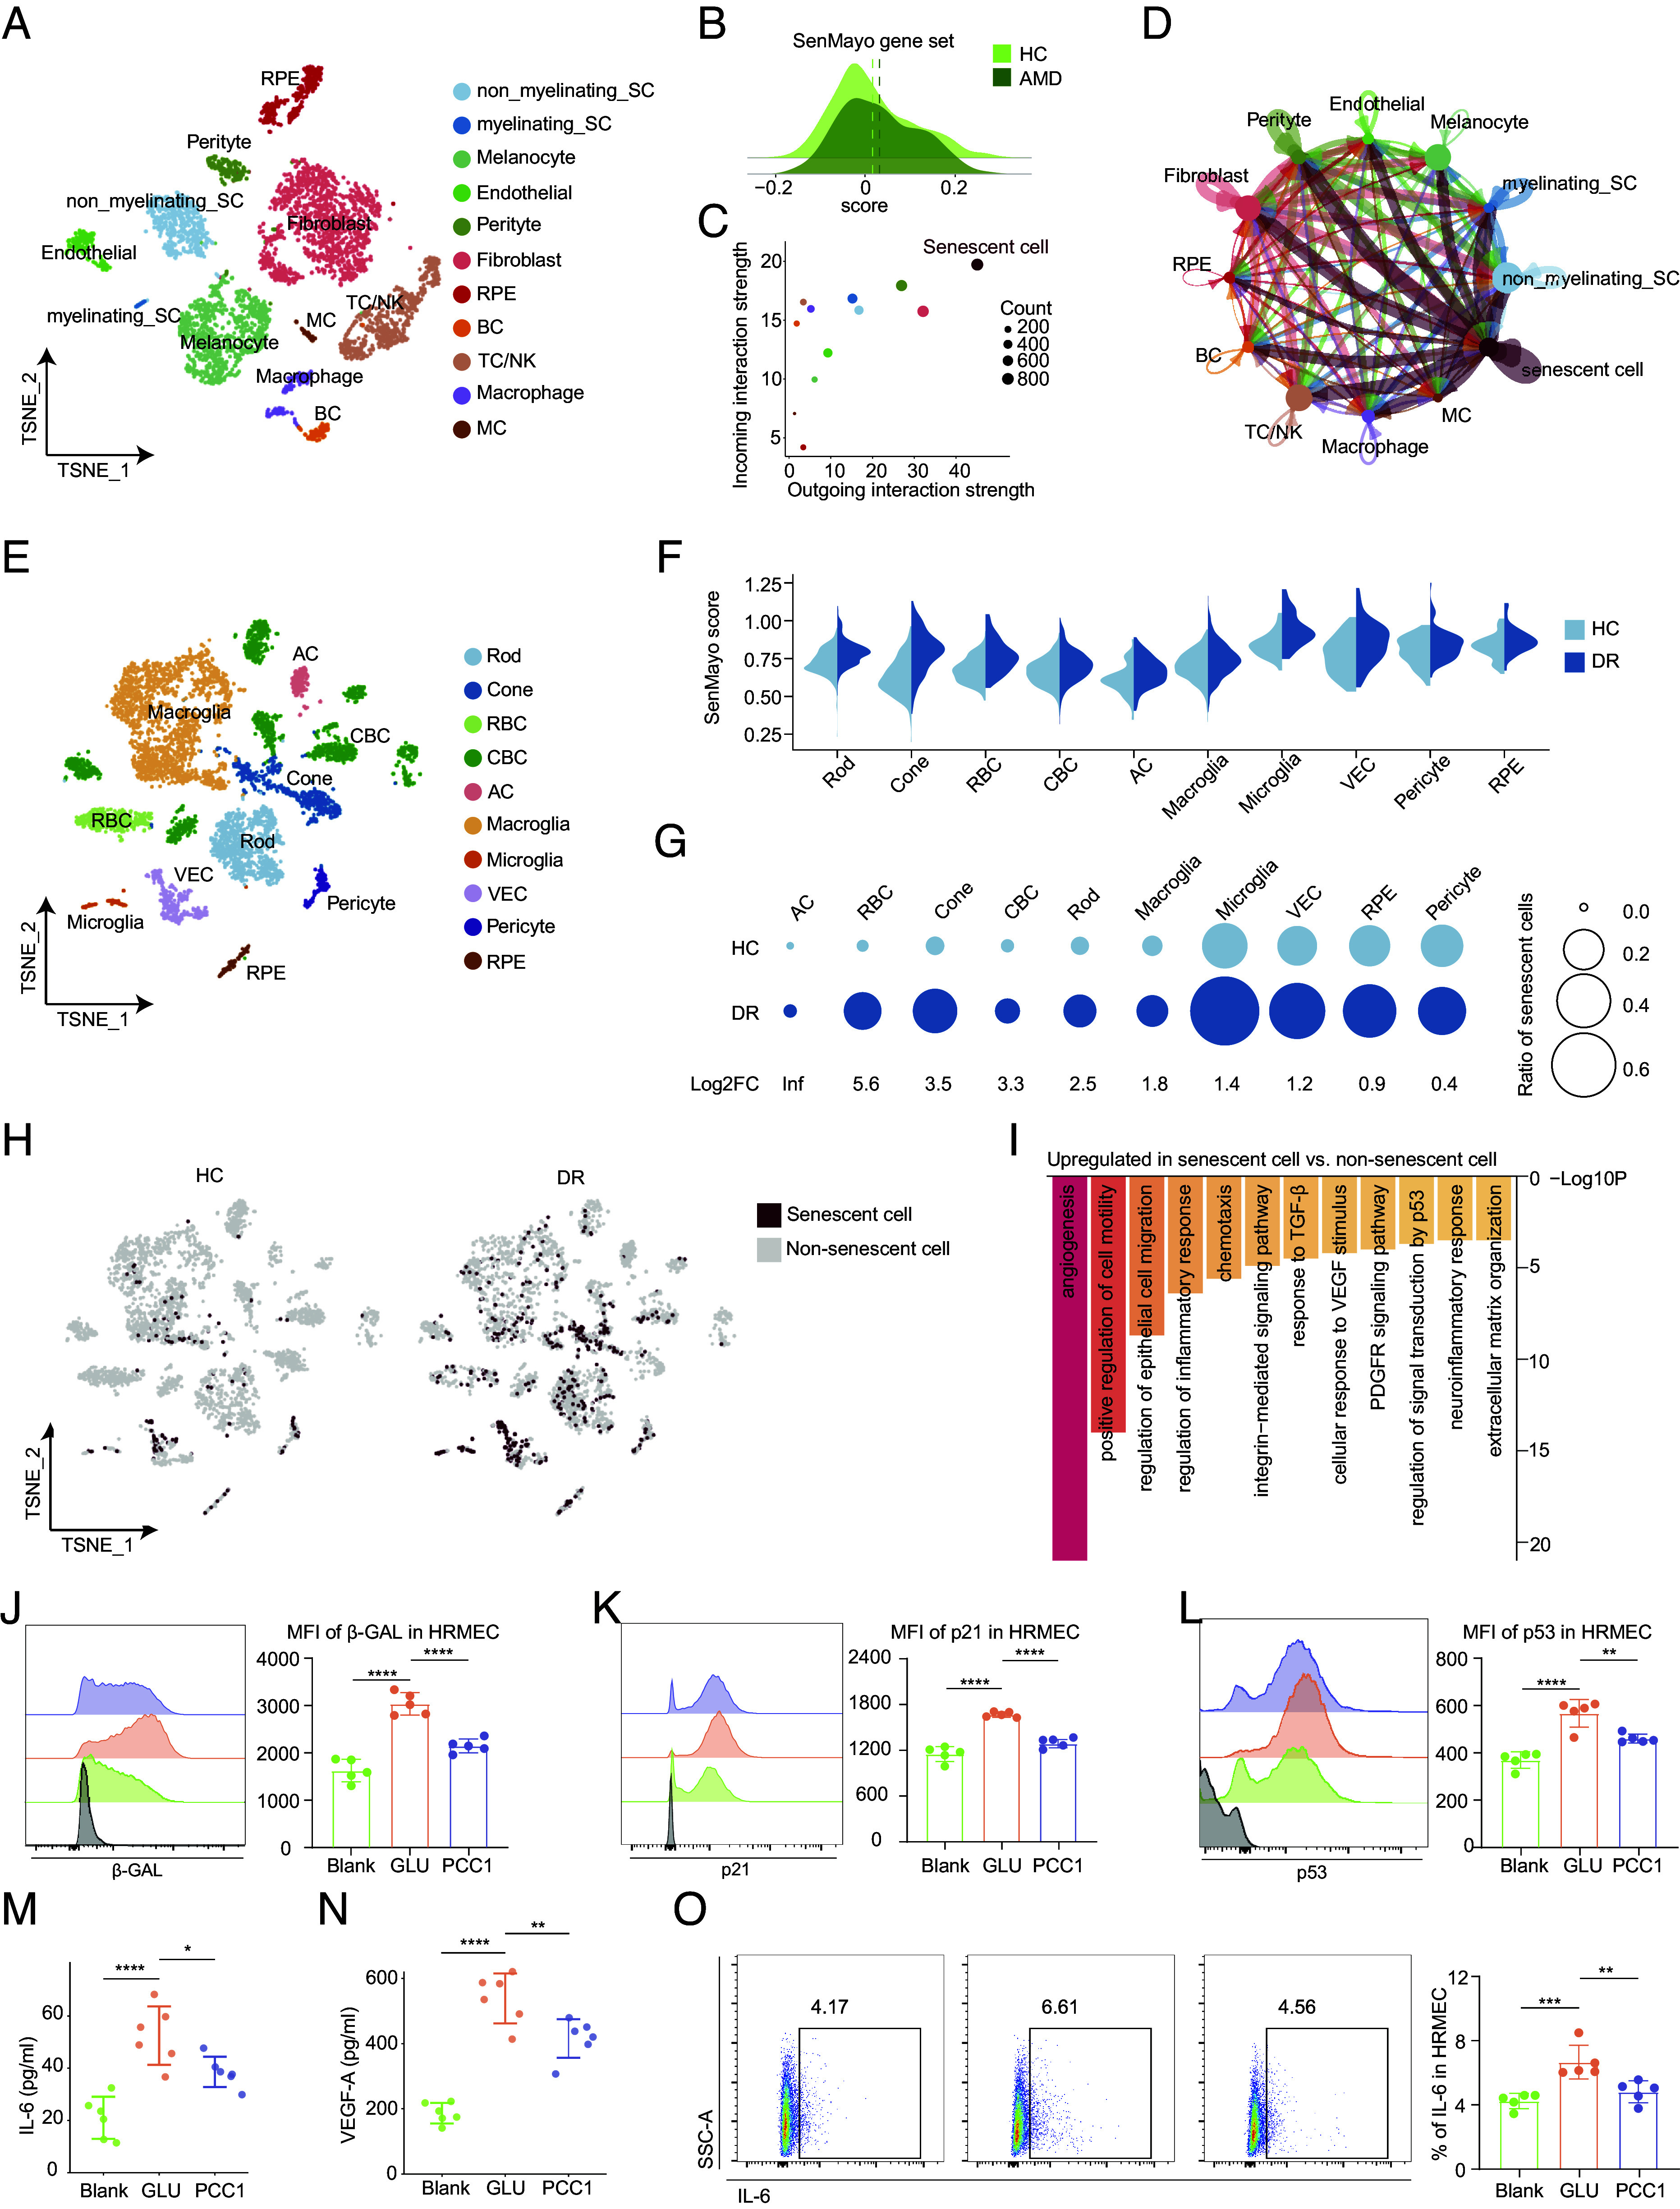
Fig. 6.

The therapeutic potential of PCC1 as a senolytic and senomorphic agent in treating age-related retinal disorders. (A) t-SNE plot showing the distribution of different RPE and choroidal cell types. (B) Ridge plot showing the expression of SASP signatures from normal and AMD groups. The dashed lines indicate the mean values. (C) Dot plot showing the incoming and outgoing interaction pattern of different cell types in the cell–cell communication. (D) Network visualization showing cell–cell interactions among different cell types. The line color indicates the source cell types. The edge width indicates the relative interaction strength between a given cell pair, and the dot size indicates the number of cells in each cell type. (E) t-SNE plot showing the distribution of different retinal cell types. (F) Split violin plots showing the ES of SASP-related genes across different cell types between the two groups. (G) Bubble plots showing the changes in cell ratios of SnC in the retina between the two groups. The numbers at the bottom indicate the log2FC values of the cell ratios (DR/Normal). The size of the dots represents the ratios of cells. (H) t-SNE plot showing the distribution of SnC in the retina between the two groups. (I) Bar plot showing the GO terms enriched for the up-regulated DEGs of SnC compared to non-SnC. (J–L) Representative FC histogram (Left) and quantification (Right) of MFI of β-GAL (J), p21 (K), and p53 (L) of HRMEC from different groups (n = 5/group). (M and N) The supernatant level of IL-6 and VEGF-A in different groups was measured by ELISA (n = 6/group). (O) Representative flow charts (Left) and quantification (Right) of the proportion of IL-6 in HRMEC from different groups (n = 5/group). Data are shown as mean ± SD, and P values were analyzed using one-way ANOVA with Bonferroni post hoc test (J–O); *P < 0.05, **P < 0.01, ***P < 0.001, and ****P < 0.0001.
