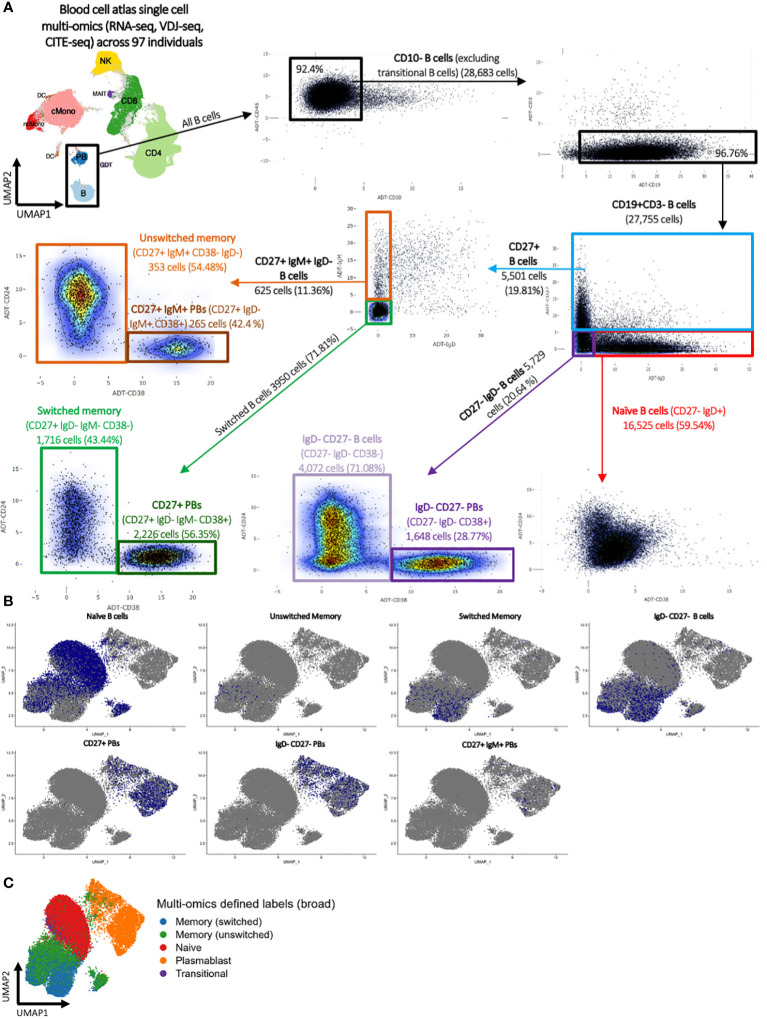
Figure 1.
Blood cell atlas single cell multi-omics (RNA-seq, VDJ-seq, CITE-seq) across 97 individuals. (A) Classical flow cytometry-style gating strategy using multi-omics CITE-seq levels to define naïve, switched and unswitched memory, IgD- CD27+ B cells, CD27+ plasmablast, CD27+ IgM+ plasmablast, and IgD- CD27+ plasmablast populations. (B) UMAP representation of the flow cytometry-style gated B cell populations and (C) the multi-omics-informed B cell annotations. The blue dots in panel (B) denote the indicated B cells as identified via flow cytometry-style gating, and the grey dots represent the remainder of cells.

