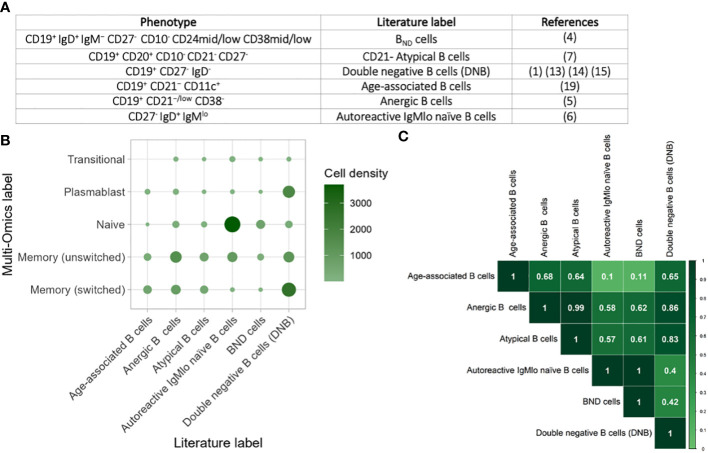
Figure 4.
Comparison of atypical B cells from the literature. (A) Table of the phenotypic markers used for classifying anergic, age-associated, autoreactive IgMlo naïve, BND, CD21- atypical, and DNB B cells across a subset of studies. (B) Heatmap of the heterogeneity of B cells captured within each flow cytometric-style gating from these studies, performed on cells from all disease states and health. The size and colour of each circle represents the number of B cells within each gate that corresponds to the single cell multi-omics label. (C) Heatmap of the overlap of B cells captured within gating strategies for the different populations. The values provided represent Jaccard overlap, where a value closer to 1 represents higher overlap between populations.

