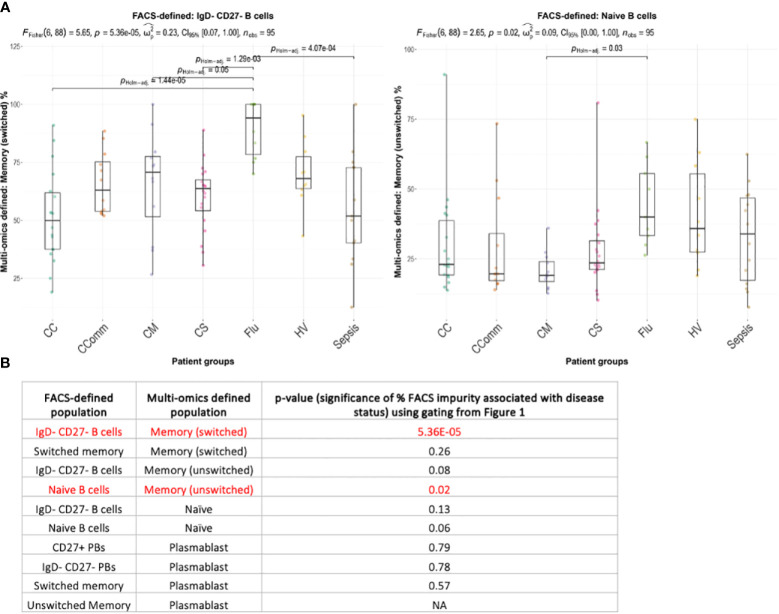
Figure 5.
Boxplots of the variation of the proportion of multi-omics-defined B cell populations within flow-cytometric style gating between diseases for (A) naïve B cells and IgD- CD27- B cells (showing only those with statistical significance), and (B) the corresponding table of significance for all comparisons. Overall p-values of frequencies associating with disease status is provided only for combinations with >3 individuals with non-zero frequencies across each disease state, given at the top of each figure (by ANOVA) and p-values between disease states are provided (by Wilcoxon test using Holm multiple testing correction). Significant values (p-values<0.05) are highlighted in red. CC, Hospitalised COVID-19 (critical); CComm, Healthcare workers COVID-19 (convalescent); CM, COVID-19 (mild); CS, Hospitalised COVID-19 (severe); Flu, Influenza patients; HV, Healthy volunteers; Sepsis, Hospitalised sepsis.

