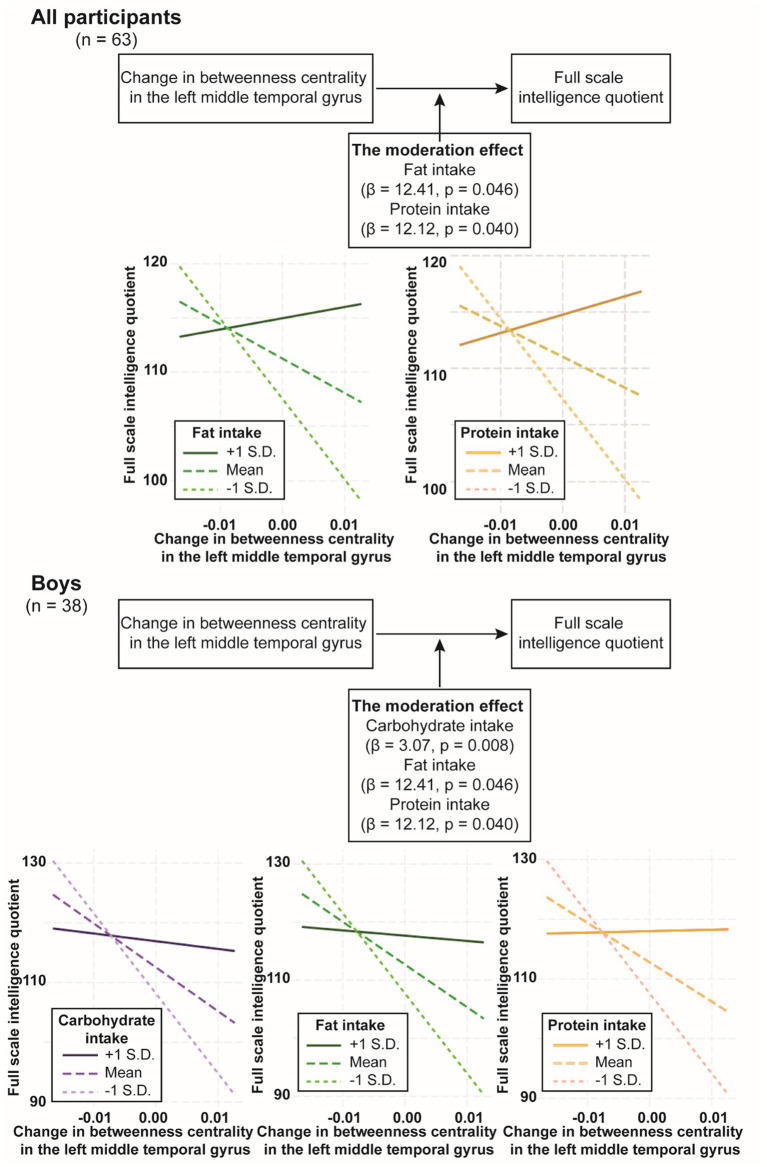
Figure 3.
The moderation effect of nutrition intake on the relationship between full scale intelligence quotient change in betweenness centrality in the left middle temporal gyrus. The diagram depicts the moderation effect on the relationship between full scale intelligence quotient and change in betweenness centrality in the left middle temporal gyrus. The X-axis of the plot represents the independent variable, which is full scale intelligence quotient. The Y-axis of the plot represents the dependent variable, which is change in betweenness centrality in the left middle temporal gyrus. The lines on the plot represent different levels of the moderator variable. Each line’s slope illustrates the relationship between full scale intelligence quotient and change in betweenness centrality in the left middle temporal gyrus at that specific level of the moderator variable. β, beta coefficient; S.D., standard deviation.

