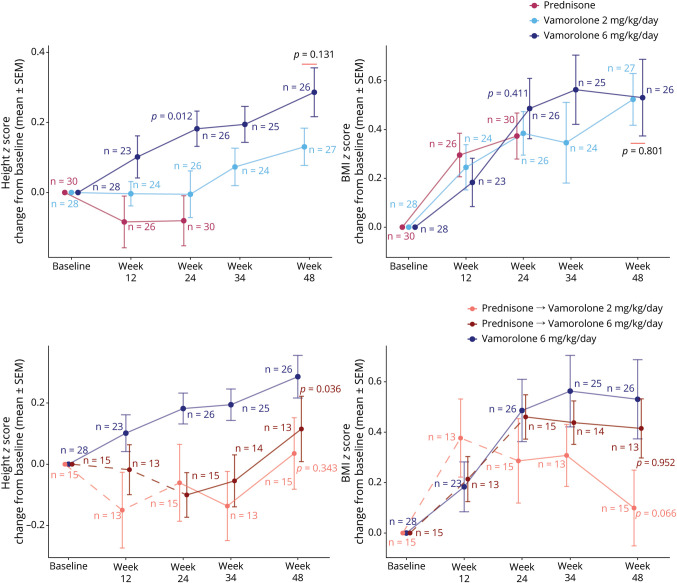
Figure 4. Safety Endpoints Over 48 Weeks of Treatment Period (mITT-2 Population).
Prednisone-treated group (period 1) is shown for reference (before cross-over to vamorolone). Unadjusted mean values and SEs are plotted using the safety-2 population. On the top panels, p values are provided for LSM comparisons from MMRM between the vamorolone dose groups over 48 weeks of treatment (safety-2 population). For context, a p value is overlaid for 24 weeks of treatment for comparison of LSM for prednisone (period 1) and vamorolone 6 mg/kg/d using the safety-2 population. On the bottom panels, p values are provided for within-group change for the prednisone crossover groups from week 24 (start of washout) to week 48 (including 20 weeks of treatment). Note that 1 time point (week 12 each time) for 3 participants (1 from vamorolone 2 mg/kg/d and 2 from vamorolone 6 mg/kg/d group) were removed because of suspected recording errors: patients had changed height by >10 cm by week 12 assessment, and future time points showed regression back closer to baseline height. Analysis including these values provided very similar findings and do not change interpretation. Color-coded (corresponding to legend) sample sizes at each time point are overlaid. LSM = least squares mean; mITT-2 = modified intention to treat–2; MMRM = mixed model for repeated measures

