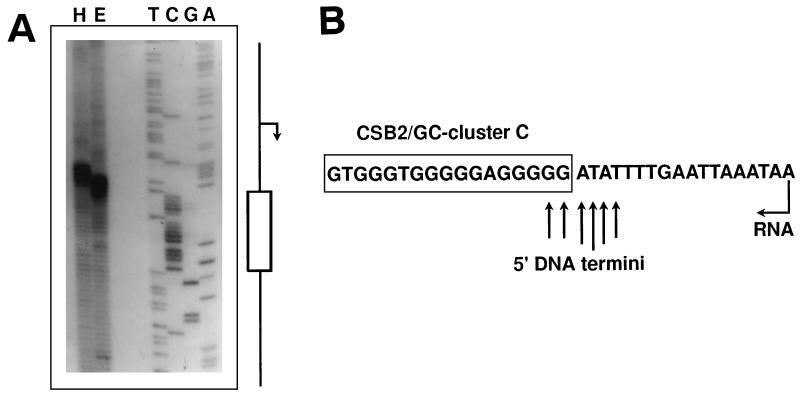
FIG. 2.
Mapping of the predominant 5′ end detected in the mtDNA of a-1/1R/Z1. (A) mtDNA samples labeled as described in Materials and Methods were digested with HpaII (H) or EcoRV (E) and displayed on a sequencing gel. Sequencing reactions generated with a primer starting at the EcoRV cleavage site and extending toward GC cluster C on pEKSori1-2 DNA were used as the markers. The positions of the promoter (bent arrow) and GC cluster C (box) on the sequencing ladder are indicated. (B) Schematic diagram showing the position of the 5′ ends in the ori1 sequence. A portion of the ori1 sequence encompassing the GC cluster C and the start site of transcription (bent arrow) is shown. 5′ DNA termini are indicated by arrows whose lengths reflect their relative intensities on the sequencing gel.

