
Figure 7.
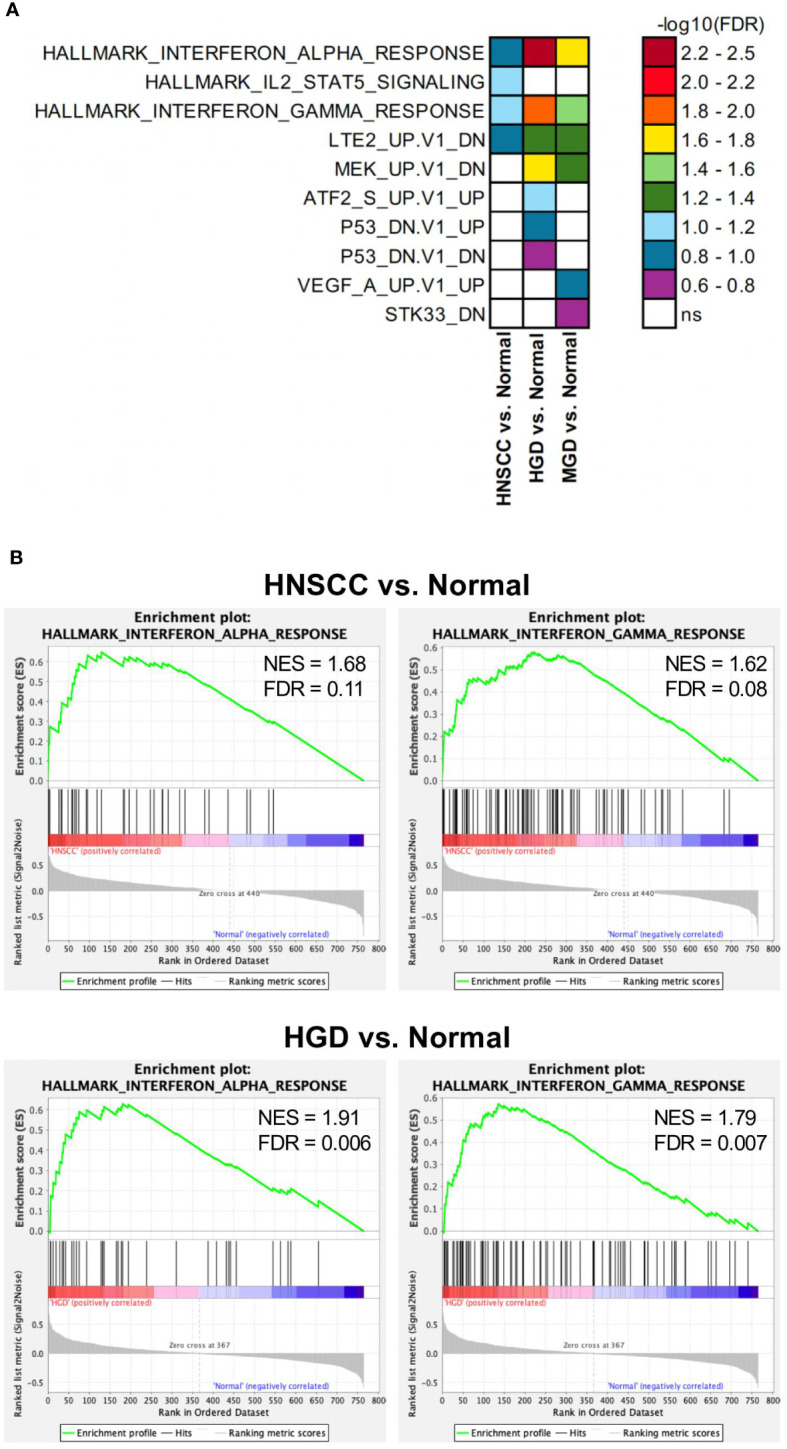
Differentially regulated pathways in HNSCC vs. Normal, HGD vs. Normal and MGD vs. Normal. GSEA results from analyses with Hallmark, c6 oncogenic signature and c7 immune pathway data sets. (A) Significantly enriched gene sets (FDR<0.25) from the Hallmark and c6 oncogenic signature data sets in indicated comparisons are depicted. FDR are presented as -log10. (B) GSEA results of the Hallmark Interferon alpha response and gamma response gene sets comparing the indicated groups. GSEA, Gene Set Enrichment Analysis; FDR, false discovery rate; ns, not significant; HNSCC, Head and Neck Squamous Cell Carcinoma; HGD, high grade dysplasia; MGD, medium grade dysplasia.