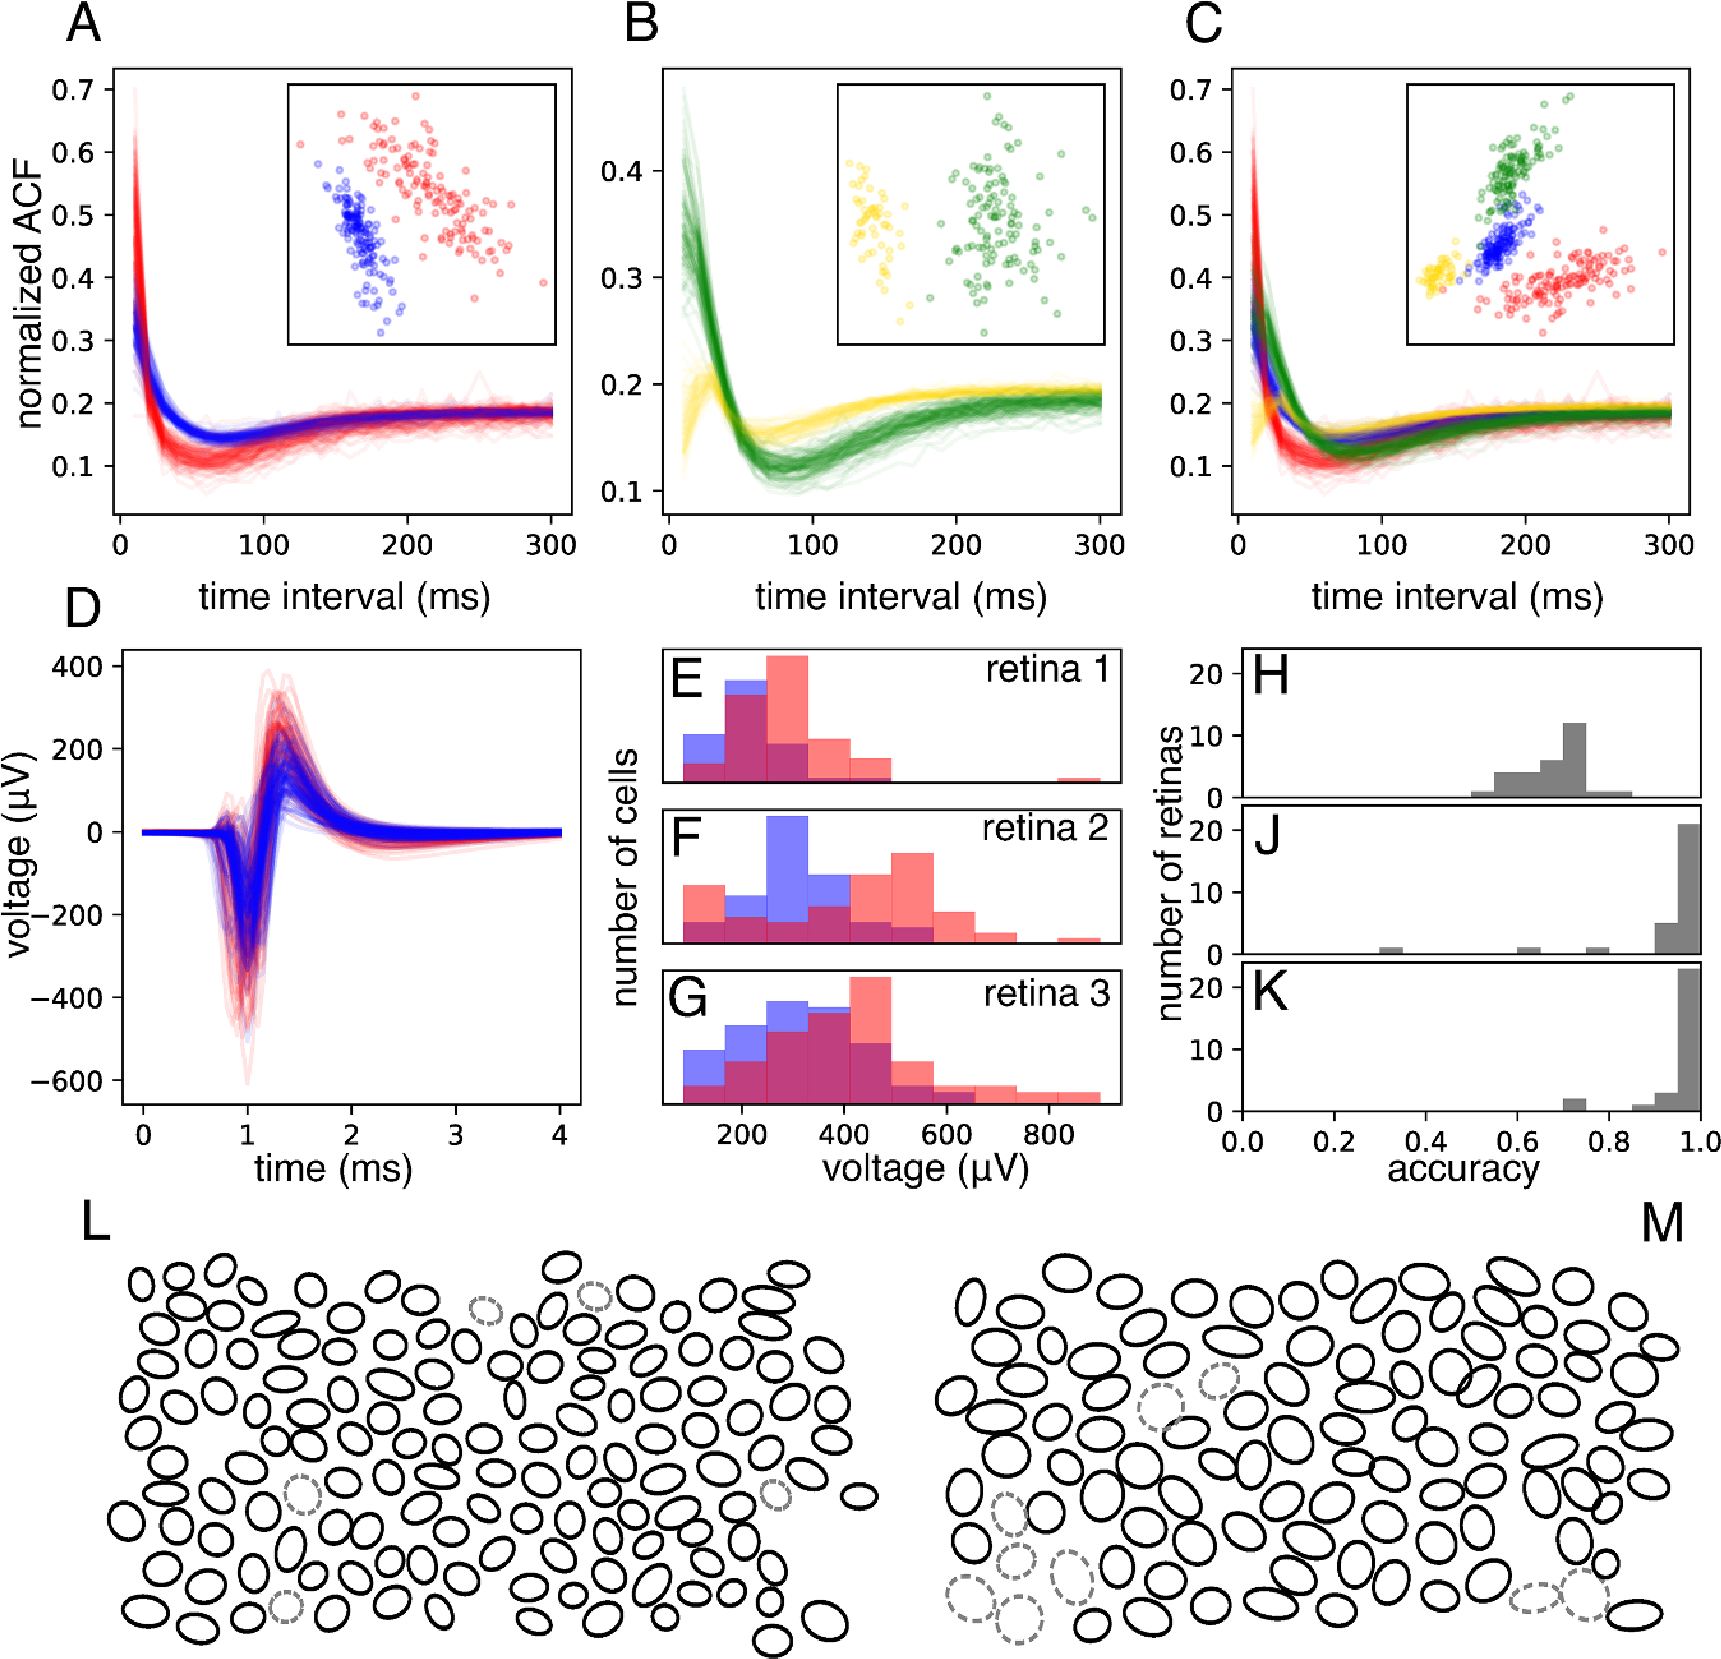
Figure 2.

Cell-type identification among ON and OFF parasol cells. (A) and (B): Comparison of the autocorrelation functions (ACFs) of ON-parasol cells (red in (A), yellow in (B)) and those of OFF-parasol cells (blue in (A), green in (B)), for two retinas (A) and (B). Insets show projection of each ACF onto the top two principal components across all ON and OFF parasol cells within that retina. (C): ACFs from (A) and (B) plotted together and projected onto common principal components (inset). (D): Main somatic spike waveforms extracted from ON (red) and OFF (blue) parasol cells in one retina. (E)–(G): Overlaid histograms of the maximum negative value (the strongest electrode waveform feature, shown here as an example), for ON (red) and OFF (blue) parasol cells within a retina, shown for three separate retinas. (H): Histogram of classification accuracy across retinas achieved with spike waveform features alone. (J): Histogram of classification accuracy achieved using combined approach of ACF-based clustering using the top two principal components and spike waveform based labeling. (K): Histogram of classification accuracy achieved using an extension of the approach shown in (J) in which multiple candidate clusterings are considered. (L): Mosaic of receptive fields (1SD contours of Gaussian fits) of the OFF-parasol cells of an example retina. Cells incorrectly labeled by the approach shown in (K) are indicated with gray dashed ovals. (M): same as (L), but the mosaic of ON-parasol cells for the same retina.
