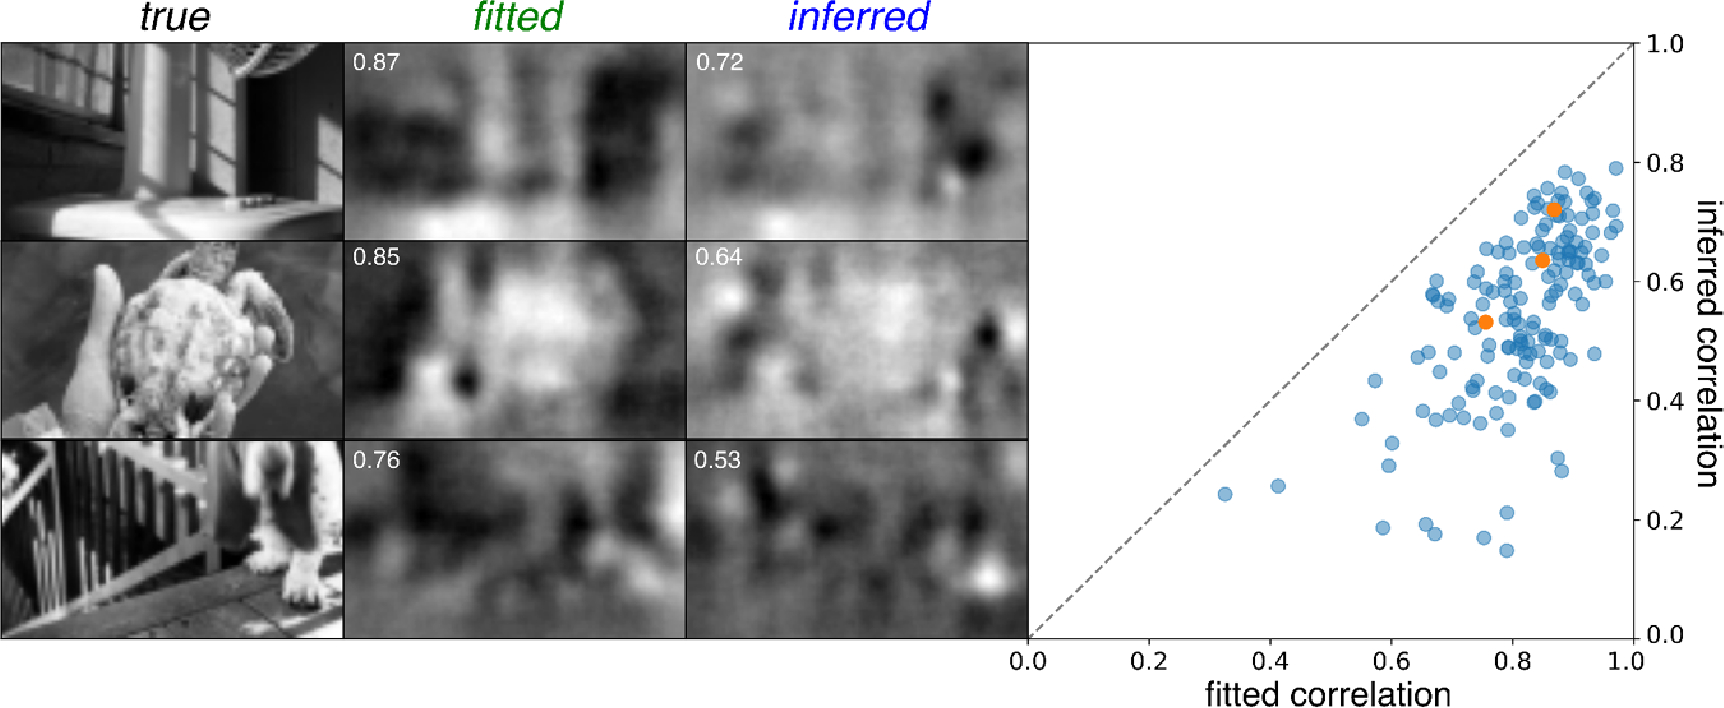
Figure 5.

Linear decoding of responses. Left: three example reconstructions from fitted model (fitted) and inferred model (inferred) responses compared to the test images used to elicit the responses (true). Performance scores (correlation with true image) is provided for each reconstruction (white inset text). Right: scatterplot of performance scores of inferred model reconstructions compared to fitted model reconstructions across 150 test images, with the three example images indicated (orange).
