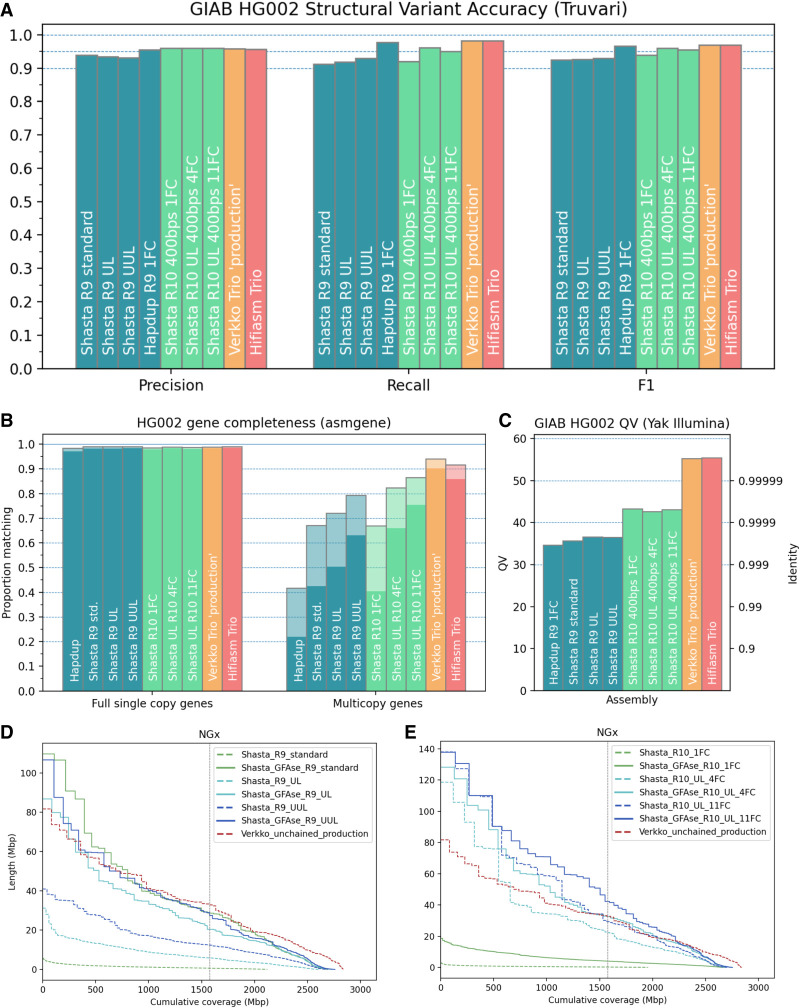
Figure 4.
Structural variant, base-level, and gene-level accuracy metrics for HG002 assemblies. (A) Base accuracy evaluated using yak with Illumina NovaSeq. (B) Gene completeness measured by asmgene using human transcript sequences. “Full single copy” genes only indicate unfragmented, nonduplicated genes, matching transcripts by ≥99% coverage and stratified by >97% (translucent) or >99% identity (opaque). Multicopy genes are similarly stratified. (C) SVs evaluated using the GIAB Tier1 benchmark VCF with Truvari. (D,E) NGx plots for Shasta haplotypes, before and after unzipping bubble chains with GFAse. For comparison, the phased portion of the unchained Verkko “production” assembly is shown. The vertical line indicates the NG50 for each assembly.

