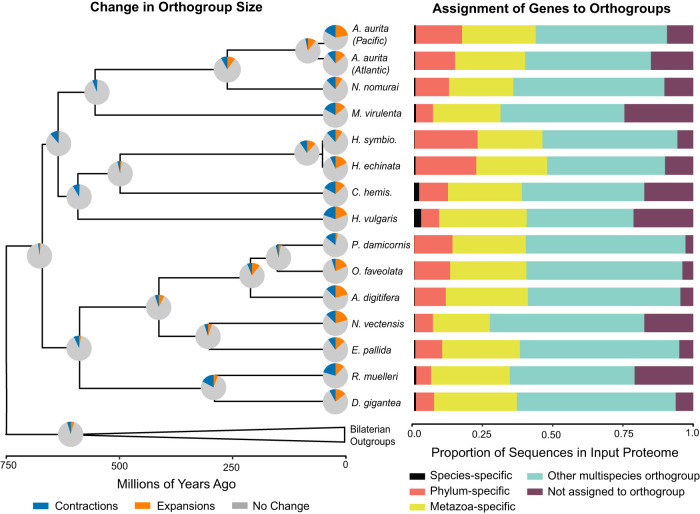
Figure 2.
Summary of orthogroup evolution across a subset of sampled taxa. (Left) Changes in gene family size estimated using CAFE. Pie charts represent changes along the branch leading to a given node or tip for all 8433 orthogroups inferred to be present in the common ancestor of this tree. Branch lengths are as depicted in Figure 1B. (Right) Proportion of input proteome sequences assigned by OrthoFinder to different orthogroup categories. For results for every species included in the OrthoFinder analysis, see Supplemental Figure S16; for the number of input sequences in each proteome, see Supplemental Table S12. The data used to create these figures can be found in Supplemental Table S12. Aurelia aurita Pacific genome from Gold et al. (2019); Baltic/Atlantic genome from Khalturin et al. (2019).

