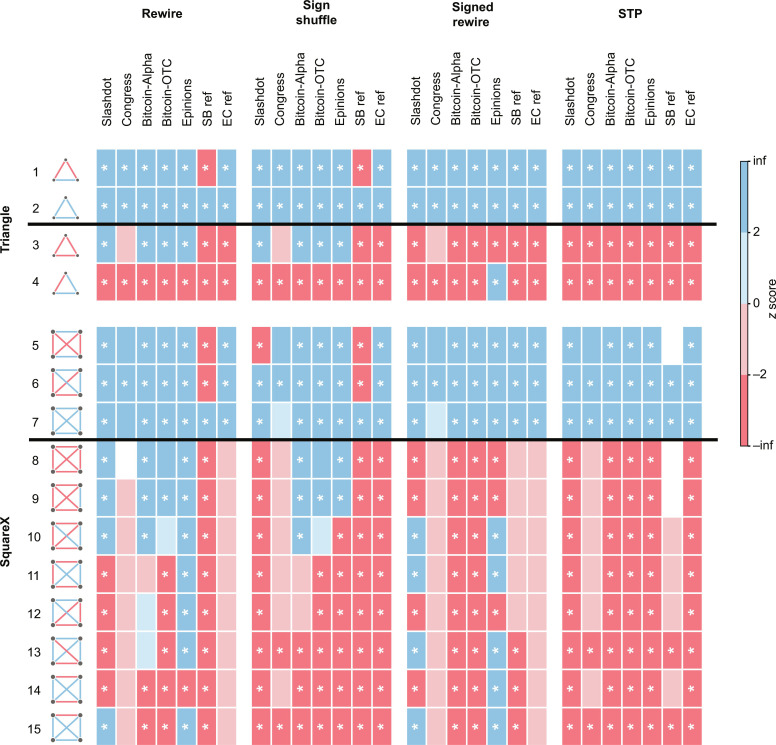
Fig. 4. Overview of the results for fully connected graphlets/motifs.
The z scores are indicated by blue (overrepresented) and red (underrepresented) blocks. We list the balanced graphlets first, separated from the unbalanced graphlets by a black line. We leave the block white if σrand = 0 as it leads to an undetermined z score. Significant results with both ∣z∣ > 2 and P < 0.01 are indicated by *. The statistical analysis is performed using a sample size of n = 1000.

