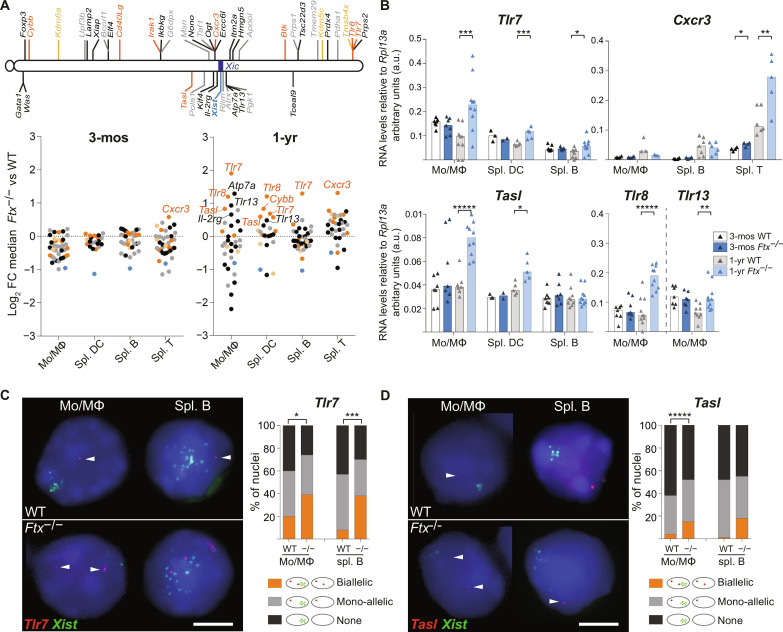
Fig. 2. Aberrant X-inactivation results in overexpression of several X-linked genes associated with autoimmune conditions.
(A) Map of the X chromosome showing genes known to constitutively escape from XCI (yellow), genes with immune function and a tendency to escape from XCI (orange), other genes with immune function (black), and housekeeping genes (gray). Underneath, log2 fold change (FC) between median RNA levels as measured by RT-qPCR in KO versus WT mice for each gene, in the indicated cell type, either in 3-month-old (left) or in 1-year-old mice (right). Each dot represents an X-linked gene. The names of genes showing significantly different RNA levels between KO versus WT are indicated on the graphs (t test, P < 0.05; n ≥ 3 mice per genotype). (B) RNA levels of Tlr7, Cxcr3, Tasl, Tlr8, and Tlr13 as measured by RT-qPCR in cell types showing detectable expression. Each triangle represents RNA levels in a mouse. Bar plots show median values (t test, *P < 0.05, **P < 0.01, ***P < 0.005, and *****P < 0.001). (C) Representative images of RNA-FISH for Tlr7 (red) and Xist (green) on WT and Ftx−/− cells from 1-year-old female mice. The percentages of cells with biallelic, mono-allelic, or no signals are shown on the histogram (chi-square test, *P < 0.05 and ***P < 0.005; N > 2 mice; n > 100 nuclei per mice). Scale bar, 5 μm. (D) Same as (C) for Tasl transcription (chi-square test, *****P < 0.001; N > 2 mice; n > 100 nuclei per mice).

