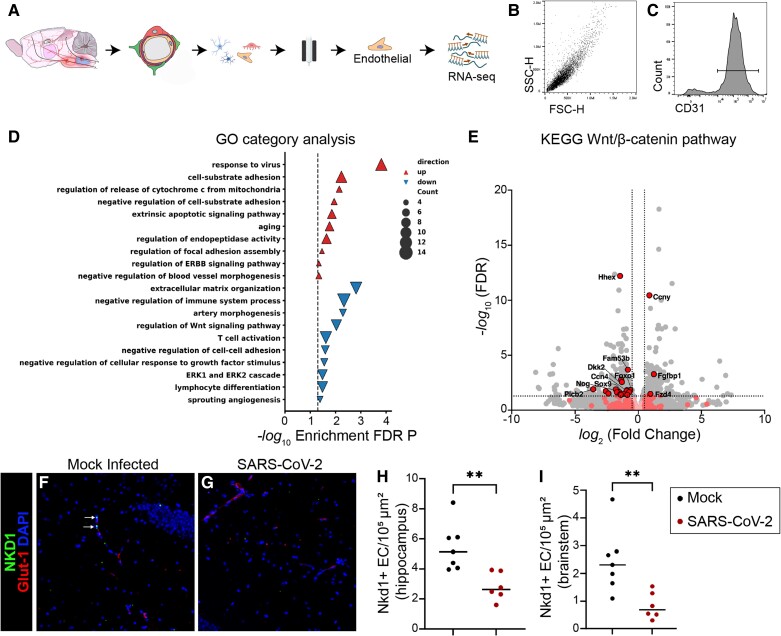
Figure 2.
Dysregulation of brain endothelial cell Wnt/β-catenin signalling in SARS-CoV-2 infection. (A) Schematic depiction of brain microvascular endothelial cell isolation protocol using gradient centrifugation and positive/negative selection 5 days after respiratory inoculation with SARS-CoV-2. (B) Flow cytometric analysis of isolated brain endothelial cells demonstrating uniform population for side-scatter (SSC-H) and forward scatter (FSC-H). (C) Flow cytometric analysis showing histogram for CD31 out of all cells in B. Ninety-four per cent of cells were positive for the endothelial cell marker CD31. (D) Gene ontology (GO) category analysis of differentially expressed genes in brain endothelial cells of mice with SARS-CoV-2 as compared to mock infection. (E) Volcano plot in which differentially expressed genes in KEGG Wnt/β-catenin pathway are depicted in red. Non-differentially expressed KEGG Wnt/β-catenin genes are depicted in pink. Grey dots represent transcripts that are not part of the KEGG Wnt/β-catenin pathway. (F and G) Immunostaining for the β-catenin transcriptional target Nkd1 (green) in brain sections of SARS-CoV-2 or mock-infected mice. Brain endothelial cells are visualized with Glut-1 (red). Nuclei are visualized with DAPI (blue). Monochromatic images are provided as Supplementary Fig. 3. (H and I) Quantification of density of Nkd1+ endothelial cells (EC) in the (H) hippocampus and (I) brainstem of SARS-CoV-2 or mock-infected mice. Each dot represents the average value obtained from two to three tissue sections per mouse. Line indicates group mean. Unpaired Student’s t-test, **P < 0.01. FDR = false discovery rate; KEGG = Kyoto Encyclopedia of Genes and Genomes.

