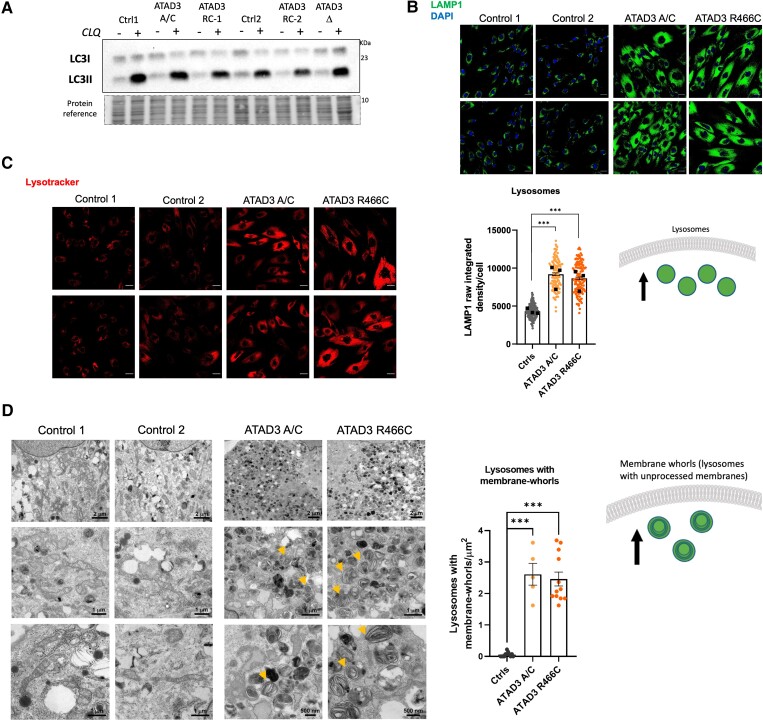
Figure 3.
ATAD3 dysfunction increases lysosome numbers maintaining autophagic flux. (A) ATAD3 A/C, deletion (Δ) and R466C cells were treated with and without chloroquine (CLQ), to block autophagy, in parallel with control cells (Ctrl). Lipidated LC3 (LC3II) was detected by immunoblotting after fractionating whole cell lysates via SDS-PAGE. (B) Top: ATAD3A mutant and control fibroblasts stained with an antibody against lysosome-associated membrane protein 1 (LAMP1, green) with DAPI (blue) stained nuclei. Bottom: Chart of LAMP1 signal (measured as raw integrated density per cell) from controls and ATAD3 mutant fibroblasts (>100 cells per line, n = 3 independent experiments). Scale bar = 30 µm. Differences between groups were analysed by unpaired, two-tailed Student’s t-test (Controls versus ATAD3 A/C, ***P < 10−7) and unpaired, two-tailed Mann-Whitney U-test (Controls versus ATAD3 R466C, ***P < 10−7). Cartoon illustrates the increase in the lysosomal pool. (C) ATAD3 mutant and control fibroblasts stained with an indicator of acidified lysosomes, Lysotracker Red. (D) Left: Transmission electron micrographs of ATAD3 mutant and control fibroblasts showing cytoplasmic content at different magnifications. Note the many structures with membrane whorls that are characteristic of lysosomal storage diseases, some of which are arrowed. Right: The chart indicates as dots the number of lysosomes with membrane -whorls in an area of 13.554 µm2 in micrographs of ×2500 magnification. Differences between groups were analysed by unpaired, two-tailed Student’s t-test (Controls versus ATAD3 A/C, ***P = 5 × 10⁻⁹) and unpaired, two-tailed Mann-Whitney U-test (Controls versus ATAD3 R466C, ***P = 7.4 × 10⁻⁷). The accompanying cartoon illustrates the accumulation of lysosomes with membrane-whorls in the ATAD3 mutant cells.

