

Abstract
Purpose
This study aims to develop a high-efficiency and high-resolution 3D imaging approach for simultaneous mapping of multiple key tissue parameters for routine brain imaging, including T1, T2, proton density (PD), apparent diffusion coefficient (ADC), and fractional anisotropy (FA). The proposed method is intended for pushing routine clinical brain imaging from weighted imaging to quantitative imaging and can also be particularly useful for diffusion-relaxometry studies which typically suffer from lengthy acquisition time.
Methods
To address challenges associated with diffusion weighting, such as shot-to-shot phase variation and low signal-to-noise ratio (SNR), we integrated several innovative data acquisition and reconstruction techniques. Specifically, we employed M1-compensated diffusion gradients, cardiac gating, and navigators to mitigate phase variations caused by cardiac motion. And we also introduced a data-driven pre-pulse gradient to cancel out eddy currents induced by diffusion gradients. Additionally, to enhance image quality within a limited acquisition time, we proposed a data-sharing joint reconstruction approach coupled with a corresponding sequence design.
Results
The phantom and in-vivo studies indicated that the T1 and T2 values measured by the proposed method are consistent with a conventional MRF sequence and the diffusion results (including diffusivity, ADC and FA) are consistent with the spin-echo EPI DWI sequence.
Conclusion
The proposed method can achieve whole-brain T1, T2, diffusivity, ADC and FA maps at 1-mm isotropic resolution within 10 minutes, providing a powerful tool for investigating the microstructural properties of brain tissue, with potential applications in clinical and research settings.
Keywords: MRF, quantitative mapping, diffusion preparation
Introduction
Over the past few decades, Magnetic Resonance Imaging (MRI) has revolutionized the field of medical diagnosis and scientific research. MRI is a non-invasive imaging technique that uses powerful magnetic fields and radio waves to produce detailed images of the internal structures of the body. It is highly versatile and can be used to visualize a wide range of tissues, including the brain, spinal cord, joints, and soft tissues. One of the primary advantages of MRI is its ability to obtain images with different contrasts by changing the scanning protocol. Parameters such as repetition time (TR), echo time (TE), flip angle, preparation time, and others can be adjusted to create images with varying tissue contrast and spatial resolution. This allows radiologists and clinicians to tailor the imaging protocol to each patient’s specific needs and to identify different types of tissue pathology, including tumors, inflammation, and hemorrhages. In clinical practice, multiple contrasts are often used for each patient to reveal lesion regions that may be obscured in other contrasts. For example, T1-weighted (T1W) images are commonly used to visualize anatomy and normal tissue, while T2-weighted (T2W) images are better suited for detecting fluid-filled structures and pathologies such as edema and inflammation. However, obtaining images with different contrasts usually requires multiple acquisitions, which prolongs the total scan time and makes MRI less accessible and less comfortable for subjects. In addition, the lengthy acquisition would make the image prone to motion artifacts. To address this challenge, researchers are exploring new techniques to reduce the acquisition time, such as parallel imaging (1,2), simultaneous multi-slice (SMS) imaging (3) and compressed sensing (4).
In addition, compared to the conventional contrast imaging, quantitative imaging is a powerful tool that can provide more accurate and reliable information about physiology or pathology. By measuring tissue properties such as T1, T2, and diffusion coefficients, quantitative imaging can provide a more direct assessment of tissue microstructure and function, which can be especially important in disease diagnosis and treatment planning (5,6). However, obtaining quantitative values with high image resolution using traditional methods can be challenging and time-consuming. These methods typically require scanning the subject multiple times with varying scan parameters, such as repetition time and echo time, in order to acquire data at different time points and contrast weightings for the estimation of desired parameters (7). The acquisition time required to obtain quantitative measurements using traditional methods can limit their practical application in a clinical setting as well as in scientific research.
One solution to this problem is the development of new quantitative imaging techniques, such as magnetic resonance fingerprinting (8) (MRF), which can acquire multiple quantitative parameters simultaneously in a single scan. This technique uses a sequence of rapidly varying radiofrequency (RF) pulses and gradient fields to encode multiple quantitative parameters into the signal, which can be separated using template matching algorithms. MRF can provide fast, accurate, and comprehensive quantitative measurements, making it a valuable tool in clinical and research settings (9–15). Additionally, MRF, which originally only measured relaxometry parameters, can be combined with other imaging techniques, such as diffusion imaging (16,17) and velocity imaging (18), to provide more detailed and complementary information about tissue microstructure and function. However, when it comes to diffusion-MRF, there are several challenges that make an efficient implementation difficult, including low signal-to-noise ratio (SNR), vulnerability to physiological motion, and system imperfections.
In this work, we report the design of a diffusion tensor imaging (DTI)-MRF method for the high-resolution whole-brain rapid quantitative imaging of T1, T2, proton density (PD), apparent diffusion coefficient (ADC) and fractional anisotropy (FA), which cover a large portion of the key tissue parameters for clinic routine brain imaging. The rapid and simultaneous estimation of T1, T2, and diffusion using this proposed method enables diffusion-relaxometry studies, which have shown promise in offering a more detailed assessment of tissue microstructure but have been challenging to perform due to their typically long acquisition times. Based on the conventional MRF framework to measure T1, T2 and PD, this method introduces a diffusion preparation module (19–24) to enable diffusion imaging simultaneously. One of the challenges in diffusion imaging is the sensitivity of accuracy to shot-to-shot phase variation induced by physiological motion (25–28) and system imperfections (29–31), such as eddy currents and imperfect gradient systems. A recent attempt to tackle this issue has provided the ability to acquire T1, T2, together with the gross anisotropic diffusion measure, at a cost of lengthy scan time (16). To overcome this challenge, the proposed method incorporates a number of new data acquisition technologies and designs to minimize phase variation, ensuring high accuracy and reliability for the diffusion imaging in this work. Another challenge in diffusion imaging is the low SNR, which was also addressed in this work by using a proposed data-sharing reconstruction strategy. In addition to its ability to generate multiple quantitative imaging parameters, this method also has the capability to produce conventional T1-weighted, T2-weighted, and diffusion-weighted contrast images using the quantitative maps. We show that this method provides an order of magnitude efficiency gain from the previous approach and enables the acquisition of all the information that traditional clinical sequences provide, and with a short acquisition time (10 minutes) and high resolution (1-mm isotropic).
The evaluation of the proposed method in phantom and healthy volunteers in a clinical MRI scanner demonstrated excellent agreement with the reference results. Notably, to the best of our knowledge, this method is the first to obtain FA mapping in in-vivo human brain imaging using diffusion preparation without an amplitude stabilizer (19) (which converts the shot-to-shot magnitude variation of diffusion preparation into phase variation and induces half SNR loss) for MRF or any other diffusion-prepared sequence.
Method
Sequence design
The sequence diagram of a normal 3D MRF (without diffusion quantification) using tiny-golden-angle-shuffling trajectory (32) (TGAS) is illustrated in Figure 1A. After an inversion pulse using an adiabatic pulse with inversion time TI=20ms, 500 TRs are acquired with an FISP-based readout (33) and varying flip angles (ranging from 10 to 75 degrees). A spatially non-selective hard pulse with 2.3-ms RF duration was utilized. Its frequency response features zero-crossing points approximately at ±440Hz, aligning with the main fat frequency at 3T, thus effectively minimizing the excitation of fat signals (34). Each acquisition period that contains 500 TRs is termed an “acquisition group.” After completing an acquisition group, a resting time is applied to allow for signal recovery before the next acquisition group. Multiple acquisition groups are used to acquire different complementary spiral encodings to fill 3D k-space (32). For example, the in-plane rotation angle and the through-plane rotation angle could be described as , where j is the index of TR and i is the index of acquisition group.
Figure 1.
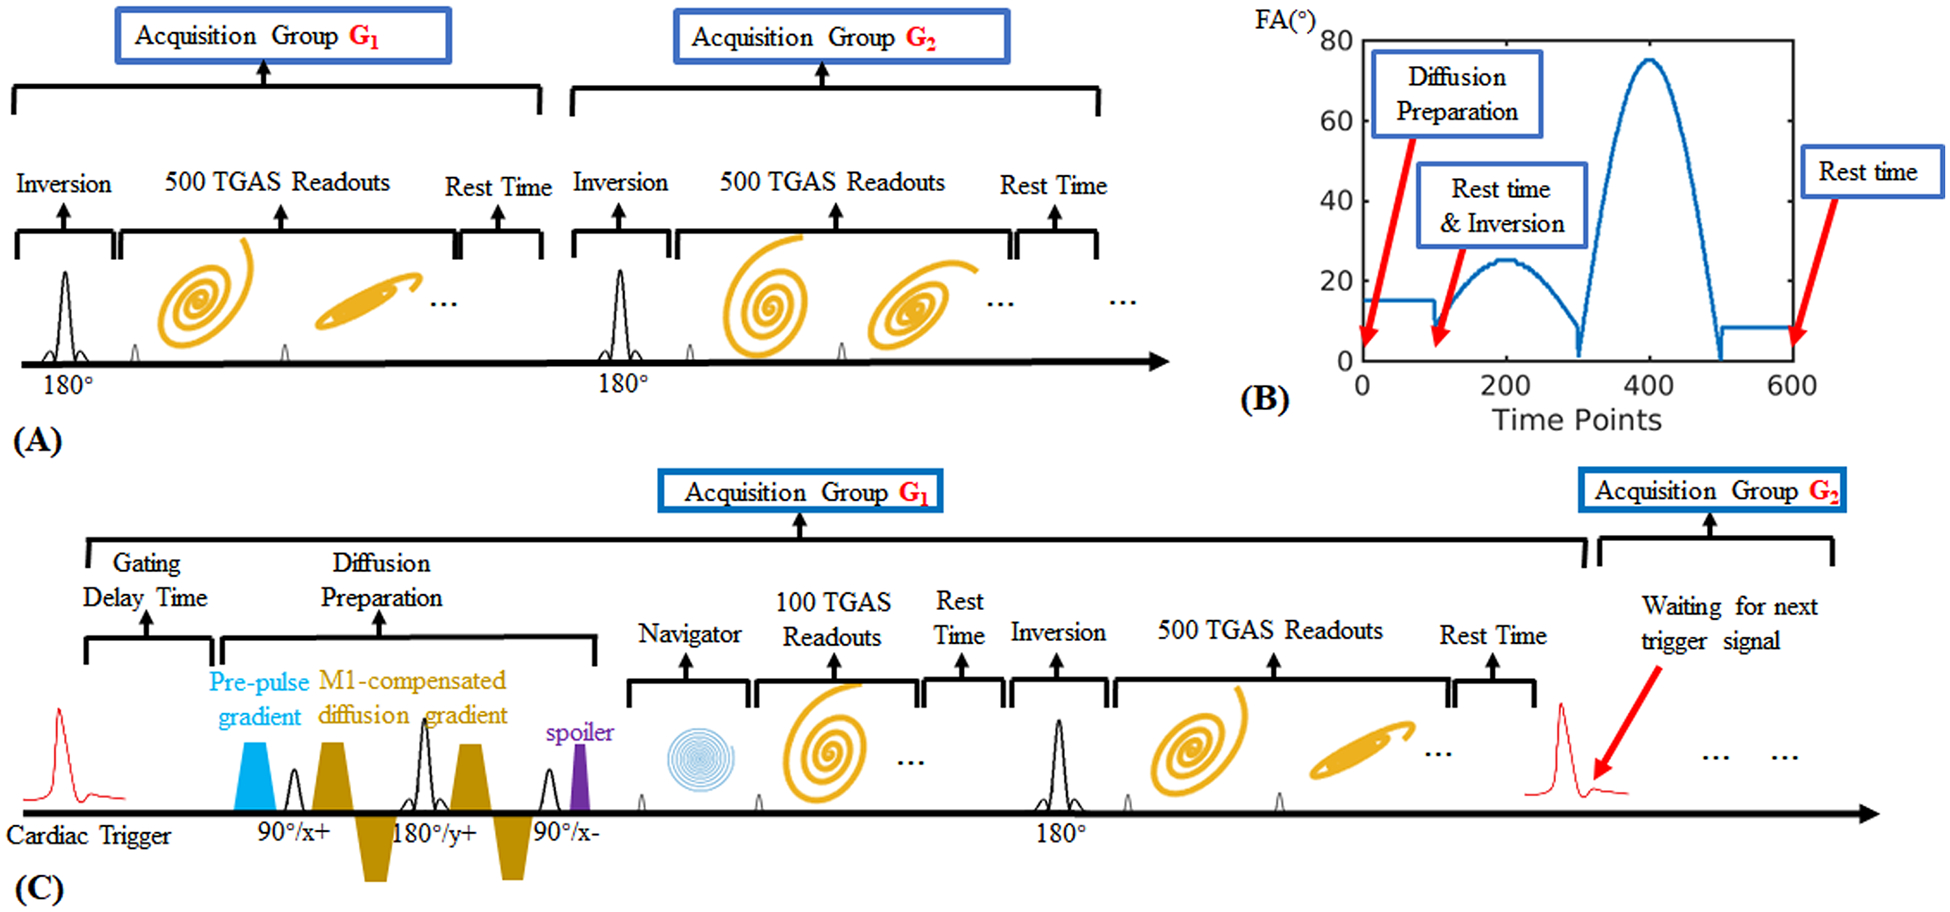
(A) The sequence diagram of a normal 3D MRF based on spiral projection (3D-SPI-MRF) method, which aims to obtain the quantitative T1, T2 and PD maps.
(B) The variation pattern of flip angles used in the proposed DTI-MRF method.
(C) The detailed sequence diagram of the proposed DTI-MRF method.
Based on this, a diffusion preparation module was incorporated into the sequence to introduce diffusion weighting, as Figure 1C shows. The diffusion preparation includes:
-
i
A cardiac gating (20,35,36) with corresponding gating delay time, which ensures diffusion preparation gradients always implemented at a same cardiac-cycle period (usually diastole) to decrease the shot-to-shot phase variation induced by cardiac-cycle motion.
-
ii
M1-compensated diffusion gradients (37) with corresponding tip-down, refocusing and tip-up RF pulses. The M1-compensation helps further decrease the phase variation by compensating the motion with constant velocity during the diffusion encoding period. M1-compensation diffusion encoding with b = 600 s/mm2 was applied with a preparation time of 60ms (including four 12.5-ms diffusion gradient lobes, two 2.5-ms 90° RF pulses and one 5-ms refocusing pulse) under the maximum gradient amplitude of Gmax = 60 mT/m and the maximum slew rate of 100 T/m/s.
-
iii
A pre-pulse gradient (38), which is used for compensating the eddy current of the diffusion gradients. To characterize the phase caused by eddy currents and determine the optimal amplitude of the pre-pulse needed to compensate for it, a spin-echo diffusion sequence with low-resolution spiral projection trajectory was used to acquire DWI images at b-values of 0 and 600 s/mm2, as shown in Figure S1 (in Supporting Information). The acquisition with b = 0 (no eddy current from diffusion gradients) would be performed only once, while the acquisition with b = 600 s/mm2 would be repeated multiple times, each time with a different amplitude of the pre-pulse gradient (represented by the blue gradient in Figure S1B of Supporting Information). The optimal amplitude was then determined by finding the value that minimizes the phase difference between the b=0 and b = 600 s/mm2 acquisitions.
Please note that this optimization approach only needs to be performed once on a phantom for a specific scanner, under the assumption that the eddy current of a particular sequence remains stable over time, and the optimal amplitude of the pre-pulse gradient would be used in the diffusion preparation to exactly cancel out the eddy current induced by the diffusion gradients, thus eliminate the phase shift and improve the uniformity of image intensity.
-
iv
A spoiler gradient after the tip-up RF pulse is implemented to clear away the residual transverse magnetization Mxy. Residual transverse magnetization may occur due to imperfect spin rephasing caused by motion or eddy currents, or due to imperfect 90-degree tip-up RF pulse caused by B1+ inhomogeneity. To prevent this from influencing the subsequent signal evolution, a spoiler gradient is applied to remove the residual transverse magnetization.
-
v
Additionally, to avoid variability in cardiac-trigger signal and other abnormal motion-causing artifacts, the first 4 TRs after diffusion preparation are used to acquire a navigator image at 4-mm isotropic resolution. Therefore, a navigator image can be extracted from each diffusion-prepared acquisition train, which can be used to determine the quality of the acquired diffusion-prepared data. Specifically, if the navigator image contains strong distortion or signal dropout, the corresponding acquisition group will be excluded from the overall reconstruction to further improve the reconstruction.
After the diffusion preparation module, additional 100 TRs were acquired to capture the diffusion-weighted signal. The spiral trajectories acquired within these 100 TRs are complementary with the ones acquired after the inversion pulse to further improve the data incoherency.
Figure 1B shows the flip angle variation pattern of the entire 600 TRs and the simplified sequence components. The repetition time (TR) is 12.5ms and the rest time is 3 seconds (1 second before the inversion and 2 seconds before the next acquisition group), resulting in a net acquisition per group of 10.5s. For 1-mm isotropic resolution acquisition across FOV of 220×220×220mm3, 8 acquisition groups were obtained in 84s per diffusion direction plus additional cardiac trigger waiting time of 4~8s, resulting in a total acquisition time within 10 minutes across 6 diffusion directions.
Reconstruction
Figure 2 shows the proposed data-sharing strategy used in this work to improve the image reconstruction quality. With 6 diffusion directions used in this work, only 8 acquisition groups were acquired per direction at 1-mm isotropic resolution for 220-mm FOV. To reconstruct the data for each diffusion direction, this data-sharing strategy jointly utilizes the first 100 TRs after the diffusion preparation of that particular diffusion direction and the 101st - 600th TRs after the inversion pulse of all the 6 diffusion directions. For example, the first 100 TRs of the 1st diffusion direction (namely the first 8 acquisition groups, indicated by the red box) and the 101st – 600th TRs of all the 48 acquisition groups (indicated by the green box) are put into the subspace reconstruction algorithm altogether. With this approach, when we want to obtain diffusion information from the first 100 TRs, which are weighted by diffusion but suffered from the low SNR, the data from 101st – 600th TRs could aid to the subspace reconstruction, thus improving the image quality.
Figure 2.

(A) Without implementing the data sharing, the subspace reconstruction only utilizes the data acquired for one diffusion direction (600 TRs by 8 acquisition groups). DP stands for diffusion preparation module and INV for inversion preparation module.
(B) Data sharing scheme. For the 1st diffusion-direction recon, 1–100 TRs of the 1–8 groups (red box) are used together with 101–600 TRs of all 48 groups (all diffusion directions, green box).
To ensure that this data sharing would not create a bias in the resulting quantitative mapping, namely that the signal evolution curves of the 101st – 600th TRs are the same for different diffusion directions, an additional waiting time of 1s was added before the inversion pulse. In this way, the signal evolution of the 101st-600th TRs becomes decoupled from the diffusion encoding. As Figure S2A (in Supporting Information) shows, the dictionary entries of same T1 and T2 values but different diffusion weightings display the same signal evolution curves after the inversion RF pulse.
To accelerate the reconstruction and reduce computational requirements, SVD coil compression(39) was employed for all reconstructions to compress the effective channel count to 6 from a 48-channel coil.
Figure S3 (in Supporting Information) shows the process of the MRF subspace reconstruction. The MRF dictionary was pre-calculated using the extended phase graph (40) (EPG) method. The resulting four-dimensional dictionary (T1 entries, T2 entries, diffusion entries and TRs, respectively) was reshaped to two-dimensions (one for entries including all T1, T2 and diffusion, one for the TRs dimension) and a singular value decomposition (SVD) was then applied on the reshaped dictionary. The first six temporal principal components were extracted as subspace bases, Φ1–6. Using subspace reconstruction (41–46), the coefficient maps (c1–6) of the bases could then be solved by:
| [1] |
where P is the undersampling pattern, F is the non-uniform Fourier transform (NUFFT), S are the coil sensitivity maps, y are the acquired raw data, and λ is the regularization parameter for locally-low-rank regularization (43,47) (LLR) . The coil sensitivity maps S were estimated with the ESPIRiT (48) method (an eigenvalue approach to auto-calibrating parallel MRI) using the central k-space data combined from all acquired TRs and groups. The reconstruction was implemented using the BART (49) toolbox.
Subsequently, the reconstructed subspace coefficient images are projected back to the time domain to obtain the time-series images (shown in Figure S3C), where the image of the first time points corresponds to the diffusion-weighted image (with additional T2-spin-echo weighting from the diffusion prep period). The time-resolved data could also be used to obtain the quantitative maps, including T1, T2, PD and e−bD maps, by implementing a template match between the acquired signal evolution and the pre-calculated dictionary entries voxel by voxel (shown in Figure S3D). The diffusivity D is then automatically obtained since b-value is given. With the obtained e−bD maps for 6 diffusion directions, the FA could be calculated using the DTI model. And the conventional contrast images could be synthesized by using either a physical model or a deep learning approach (50). In this study, we employed the EPG (40) method to generate contrast-weighted images using quantitative maps and typical clinic scanning parameters (TI, TE, TR, FA, and etc.).
Embedded into the subspace reconstruction and dictionary fitting, B1+ correction and B0 correction were also deployed to further improve the quantitative accuracy and image quality (32). B1+ and B0 maps were acquired by using a quick 3D Bloch-Siegert based calibration scan (51).
Implementation
To validate our proposed method, five healthy volunteers were scanned with the approval of Institutional Review Board (IRB). Studies were performed on a 3T MAGNETOM Prisma scanner (Siemens Healthcare, Erlangen, Germany) with a 64-channel head receiver coil and a 3T Premier MRI scanner (GE Healthcare, Madison, WI) with a 48-channel head receiver coil. Computations were performed on a Linux (Ubuntu 20.04) server (with 32 Core i7 Intel Xeon 2.8 GHz CPUs, an Nvidia 2080Ti GPU and 512GB RAM) using MATLAB R2019a (The MathWorks, Inc., Natick, MA).
To further evaluate the accuracy and reliability of the proposed method, a phantom study was conducted to obtain quantitative maps of T1, T2, and e−bD (of one single diffusion direction) using both the proposed method and reference methods. The reference T1 and T2 maps were acquired using conventional 3D-SPI-MRF (32,52), which has been previously validated in both phantom and in-vivo studies. The reference e−bD map was obtained using DWI SE-EPI, which is considered the gold standard in diffusion imaging.
Results
We assessed the effectiveness of the proposed method in a healthy volunteer using a clinical MRI scanner and the results are presented in Figure 3. The proposed method enabled the acquisition of multiple quantitative maps, including T1, T2, PD, ADC, FA, and colored FA of the entire brain with high 1-mm isotropic resolution in just 10 minutes.
Figure 3.

Whole-brain T1, T2, proton density, ADC, FA and colored-FA maps from DTI-MRF with 1-mm isotropic resolution and 10-min acquisition time.
The proposed method not only enables the generation of multiple quantitative maps but also allows for the generation of conventional clinical contrast images, providing a comprehensive tool for clinical imaging. As shown in Figure 4, using the quantitative maps obtained from the proposed method, we were able to generate six commonly used clinic contrast images (53–56), including MPRAGE (magnetization-prepared rapid gradient echo), T1W, T2W, T2 FLAIR (fluid attenuated inversion recovery), DIR (double inversion recovery) and DWI (diffusion-weighted imaging). MPRAGE and T1W are widely used in structural imaging, while T2 FLAIR is commonly used in clinical diagnosis. A comparison between the synthesized images using the proposed method and the ones acquired using the vendor’s product sequence could be found in Figure S4( Supporting Information).
Figure 4.

Synthesized clinic contrast images using the quantitative results obtained by using the proposed DTI-MRF.
Validation
The top images in Figure 5A display the T1, T2, and diffusivity maps obtained using the proposed method, while the bottom images depict maps using the reference methods. The corresponding mean values and standard deviations are shown in Figure 5B. The results demonstrate a high degree of agreement between the proposed method and the reference methods, indicating that the proposed method is accurate and reliable in obtaining quantitative maps of T1, T2, and diffusivity.
Figure 5.

(A) T1, T2 and diffusivity maps using DTI-MRF (top row) compared with reference images (bottom row) for a phantom experiment.
(B) For each tube within the phantom, the mean values and standard deviations of the T1, T2 and diffusivity values from the proposed method are plotted against those from the reference methods.
The reference T1 and T2 maps were acquired using a normal 3D-SPI-MRF while reference diffusivity map was acquired using DWI SE-EPI.
The validation study on a healthy volunteer was conducted to further test the accuracy and reliability of the proposed method. In this study, the proposed method was used to acquire whole-brain quantitative maps of T1, T2, PD, ADC, FA, and colored-FA with 1-mm isotropic resolution using six diffusion directions. The results of this study were presented in Figure 6, which shows the quantitative maps obtained using the proposed method (top) and the reference methods (bottom). The Supporting Information Table S1 shows the average values and standard deviation of T1, T2, ADC and FA of two selected ROIs. The results show similar patterns between the proposed method and the reference methods, indicating good consistency. And the T1, T2, ADC and FA values of more other brain structures/regions among 3 healthy subjects could be found in the Supporting Information Table S2.
Figure 6.

In-vivo T1, T2, ADC, FA and colored maps using DTI-MRF (top) compared with reference images (bottom) acquired from a healthy subject.
The reference T1 and T2 maps were acquired using a normal 3D-SPI-MRF while reference ADC, FA and colored FA maps were acquired using DWI SE-EPI.
Compensation for phase variation
We utilized motion compensation and cardiac gating to encode diffusion information while compensating for shot-to-shot image variations that typically occur due to physiological variations. Diffusion preparation is a critical step in obtaining accurate and reliable diffusion imaging, however, this step can also introduce shot-to-shot phase variation caused by microscopic motions (57,58), such as cardiac-cycle motion, which results in unwanted intensity variation in the images. To mitigate this issue, an amplitude stabilizer gradient (19) (dephaser) can be applied prior to the tip-up 90° RF pulse to dephase the spins while a rephasing gradient must be applied prior to each readout in the subsequent readout-train to rephase the diffusion-encoded spins as per previous work in diffusion-MRF (16).However, this approach comes at a cost of halving the signal (20,59) and the rephasing gradient will also dephase any signal from the recovering Mz during its long readout train, making this approach quite inefficient in encoding diffusion information into the MRF acquisition where lengthy continuous readouts are acquired. To verify this point, the signal evolution curves of the same T1, T2 and e−bD values are simulated for the cases with and without amplitude stabilizer. The simulation indicated that the signal intensity (transverse magnetization Mxy) acquired without the amplitude stabilizer (Figure S2A in Supporting Information) was significantly higher than those with the amplitude stabilizer (Figure S2B).
In order to minimize motion-sensitivity shot-to-shot magnitude variation without using an amplitude stabilizer, the proposed method utilizes a combination of cardiac-gating (60) , M1-compensated (21,37) diffusion preparation, and navigators. This approach reduces the need for an amplitude stabilizer gradient, which helps to maintain the SNR and allows for continuous readouts in the MRF framework.
In Figure S5A (in Supporting Information), the results showed that the diffusion-prepared images with 0ms-delayed cardiac gating reduced the motion-induced artifacts compared to no cardiac gating. In Figure S5B, the e−bD maps generated using M0-compensated and M1-compensated diffusion preparation did not show a significant difference in the upper part of the brain, but in the lower part, where cardiac motion artifacts were more prevalent, the M0-compensated diffusion preparation led to a significant decrease in image quality. This demonstrates the importance of using the M1-compensated diffusion preparation method to correct for motion-induced phase variation. Figure S5C displays the reconstructed navigator images from the proposed method with Gz diffusion encoding, showing a small number of acquisition groups with signal voids that need to be removed for better reconstruction. This signal void issue was particularly prominent for diffusion along Gz direction, as cardiac motion is most severe in this direction (61).
In Figure 7, the e−bD maps for z-direction diffusion are shown, where the application of cardiac gating, M1-compensated diffusion preparation, and signal removal via navigator progressively improved image quality, further validating the effectiveness of the proposed method.
Figure 7.

The e-bD maps acquired using the proposed sequence without cardiac gating (1st column), with cardiac gating plus M0-compensated diffusion preparation (2nd column), with cardiac gating plus M1-compensated diffusion preparation (3rd column), with cardiac gating plus M1-compensated diffusion preparation plus navigator (4th column).
Eddy current compensation
In addition to the shot-to-shot phase variation caused by the motion, the unbalanced moment of diffusion gradient could be another source of phase variations. Ideally, the spins would rephase prior to the tip-up RF pulse, however, the eddy current (38,62,63) from the strong diffusion-encoding gradients could introduce extra phase change and cause the spins not rephase properly, resulting in an insufficient tip-up flip from Mxy to Mz (20). Since the eddy-current field is spatially dependent, it would lead to a non-uniform image intensity that does not reflect the actual diffusion weighting. In addition, since there are multiple different diffusion directions implemented for the DTI model (64), the level of magnitude attenuation level changes from one diffusion direction to the other, resulting in an incorrect diffusion measurement.
Figure 8 demonstrates the phase difference between b = 0 and b = 600 s/mm2 using the same sequence shown in Figure S1obtained with the pre-pulse gradient applied along the x-axis. Figure 8B shows an approximately linear relationship between the amplitude of the pre-pulse gradient and the average phase difference. This linear relationship can be used to determine the optimal pre-pulse gradient amplitude for optimal correction of eddy current-induced phase errors. To take advantage of this linearity, phase difference measurements were obtained at just several different amplitude settings, and interpolation was used to determine the amplitude level that provides optimal correction. Figure 8C shows an example of the correction applied to the first diffusion direction with a diffusion vector of [1,0,1]. The optimal pre-pulse gradient amplitudes for this direction were approximately −10 mT/m for the Gx direction and −15 mT/m for the Gz direction.
Figure 8.

(A) Phase difference maps using spin-echo diffusion sequence between b=0 and b=600 s/mm2 with amplitude of the pre-pulse gradient varying from −60mT/m to 60mT/m for diffusion direction applied at Gx, Gy and Gz, respectively.
(B) Average phase difference across 3D images of (A).
(C) Phase difference for the six diffusion directions used in DTI-MRF. Since each direction used two different gradient axes (e.g. Gx and Gz for the 1st direction), a two-dimensional compensation was implemented.
Figure 9 shows the phase difference maps (top row, using the sequence shown in Figure S1 of Supporting Information) and e−bD maps (middle row, using the proposed sequence shown in Figure 1, of one single diffusion direction as example). Without the eddy-current compensation, strong phase differences are observed, resulting in a significant bias on the e−bD maps compared to those obtained using DWI SE-EPI (bottom row). However, with the pre-pulse eddy-current compensation, the phase difference is minimized, mitigating the bias in the e-bD maps. This demonstrates the effectiveness of pre-pulse compensation in reducing the impact of eddy current-induced phase errors on diffusion MRI measurements. And the cases of more diffusion directions could be found in Supporting Information Figure S6, indicating that the phase difference could be varied significantly from direction to direction. To assess the consistency of the eddy-current-compensation efficacy when using pre-pulse gradients, we evaluated the phase difference, maintaining uniform settings across different subjects and timeframes. The outcomes, derived from eight separate measurement sessions, can be found in Supporting Information Figure S7. These results indicate that phase differences, spanning six diffusion directions and multiple sessions, remain within a tolerable range, thereby contributing to precise quantitative estimations.
Figure 9.

The phase difference maps as measured using SE-EPI between b=0 and b=600 s/mm2 (top row), e−bD maps using DTI-MRF (middle row) and the reference e−bD maps using SE-EPI (bottom row), without (left column) and with (right column) the pre-pulse eddy-current compensation.
Reconstruction with data sharing strategy
As shown in Figure 10, the reconstructions with and without using the proposed data sharing strategy were compared, and the former demonstrated significantly better image quality than the latter for both e−bD maps and colored-FA maps. Since diffusion imaging is limited by its poor SNR, the normal reconstruction method without data sharing is prone to noise in the images. Hence, more acquisition repetitions are required to obtain images with decent quality, leading to a longer acquisition time. With the data sharing strategy, good image quality can be achieved within a much shorter acquisition time.
Figure 10.

The e−bD maps of 6 diffusion directions and its corresponding colored FA maps without (top row) and with (bottom row) using data sharing strategy in the reconstruction.
Discussion and Conclusion
In this study, we introduced a novel DTI-MRF method for whole-brain mapping of T1, T2, PD, ADC, and FA with 1-mm isotropic resolution within 10 minutes. Additionally, our method can synthesize corresponding contrast images, including MPRAGE, T1W, T2W, T2 FLAIR, DIR, and DWI, which are commonly used in daily clinical applications. However, obtaining these contrast images using traditional methods can take a considerable amount of acquisition time, often around half an hour or longer for high isotropic resolution cases, making it impractical for many patients due to the high scan cost and discomfort. Our proposed method, on the other hand, can achieve these high-resolution contrast images within a much shorter acquisition time (a comparison across similar methods (16,65,66) that aim for quantifying T1, T2 and diffusivity could be found in the Supporting Information Table S3), improving patient comfort and accessibility. Moreover, the simultaneous acquisition of multiple quantitative maps provides a more comprehensive assessment of tissues, advancing from traditional non-quantitative contrast images to quantitative maps which has the potential to improve clinical diagnosis and scientific research.
In order to optimize diffusion preparation and minimize the impact of motion and hardware imperfections, several strategies were employed in this work, including cardiac gating, M1-compensated diffusion gradients pairs, navigators, and pre-pulse gradients. The combination of these approaches effectively mitigates shot-to-shot and direction-to-direction phase variations, resulting in improved image uniformity and more accurate quantitative estimations. It is worth noting that this proposed method is the first diffusion-prepared approach that achieves FA estimation for in-vivo human brain scans without using an amplitude stabilizer, which stabilizes the acquisition at a cost of halving the SNR. This is a significant improvement since SNR is an essential limiting factor for diffusion imaging.
In addition, this work also introduced a novel k-space sharing scheme to improve image quality. By jointly reconstructing the k-space data weighted by diffusion preparation of one single diffusion direction and those isolated from diffusion weighting, the reconstruction conditioning was significantly improved, thus aiding diffusion estimation, which is usually limited by poor SNR. This k-space sharing scheme also introduced an intriguing idea of acquiring a normal MRF dataset containing T1 and T2-weighted k-space data as a k-space database, and then flexibly acquiring data weighted by diffusion or other tissue contrasts, such as myelin water fraction(67,68), magnetization transfer (69,70), T2* (71,72) and T1ρ (73,74). By allowing them to acquire complementary k-space data, a joint reconstruction with a subspace model can improve image quality for both and thus improve quantitative estimation. This approach can be applied to improve quantitative mapping methods that suffer from lengthy acquisition times and/or poor SNR.
Our findings underscore the pivotal role of accurate and reliable eddy-current compensation in ensuring correct diffusion estimation. This area will likely be a focal point in our subsequent research. For example, to further improve our eddy compensation approach, a more efficient and accurate approach for estimating the suitable gradient amplitude for the pre-pulse gradient used for compensating the eddy current could be considered, for example, the Skope filed camera (75). The current approach measures the phase difference between diffusion gradient off and on with different gradient amplitudes of the pre-pulse gradient and fit for the gradient amplitude that should minimize the phase difference. While this approach utilizes the linearity between the eddy current and gradient amplitude to reduce the number of measured gradient amplitude values, it still requires a considerable amount of time, especially when there are numerous diffusion directions, and some of them require the use of all three gradient directions (Gx, Gy, and Gz) to generate a specific diffusion direction. Small differences in the ADC map’s uniformity and ADC values using the proposed method when compared to the reference approach using EPI, could be caused by incomplete eddy current compensation. Instead of using the pre-pulse gradient for eddy current compensation, one can also consider using dynamic shimming coils (76–78) to reduce the eddy-current-induced phase change. With advanced approaches to correct the eddy current, and/or with emerging high performance gradient systems that can be used to create motion-compensated diffusion encoding with a smaller footprint, the implementation of higher b-values would become more feasible, especially considering that the b-value used in this work is limited (600 s/mm2). In this way, those artifacts and ADC underestimation related to imperfect eddy-current compensation could be further reduced.
Given our aim to achieve high isotropic resolution within a constrained acquisition time, managing SNR and regularization tradeoff can be challenging. Consequently, we opted for a relatively high level of regularization in the locally low-rank constraints, which might induce potential blurring. Moreover, since the LLR is implemented across all coefficient maps, over smoothing along the temporal dimension could potentially induce quantification bias, such as small ADC underestimation. To address this issue, we will try using the Cramér–Rao lower bound (CRLB) (79) to optimizing the flip angle pattern for boosting SNR and introducing deep-learning-based denoiser, thus could enable us to reduce the amount of regularization used.
Overall, the proposed DTI-MRF method provides a powerful tool for investigating the microstructural properties of brain tissue, and its quantitative results can be used to generate useful clinic contrast images to aid in clinical decision-making. The quantitative tissue parameters would open up an exciting area in high fidelity quantitative analysis, particularly in the emerging field of radiogenomics and big data.
Supplementary Material
Acknowledgment
This work was supported in part by NIH research grants: R01-EB020613, R01-EB019437, R01-MH116173, P41EB030006, U01-EB025162, and GE Healthcare.
Footnotes
In the preparation of this manuscript, the OpenAI’s Large Language Model (LLM), specifically the GPT-4 architecture, was utilized for grammar check.
Reference
- 1.Pruessmann KP, Weiger M, Scheidegger MB, Boesiger P. SENSE: Sensitivity encoding for fast MRI. Magn. Reson. Med 1999;42:952–962 doi: . [DOI] [PubMed] [Google Scholar]
- 2.Deshmane A, Gulani V, Griswold MA, Seiberlich N. Parallel MR imaging. J. Magn. Reson. Imaging 2012;36:55–72 doi: 10.1002/jmri.23639. [DOI] [PMC free article] [PubMed] [Google Scholar]
- 3.Setsompop K, Gagoski BA, Polimeni JR, Witzel T, Wedeen VJ, Wald LL. Blipped-controlled aliasing in parallel imaging for simultaneous multislice echo planar imaging with reduced g -factor penalty. Magn. Reson. Med 2012;67:1210–1224 doi: 10.1002/mrm.23097. [DOI] [PMC free article] [PubMed] [Google Scholar]
- 4.Lustig M, Donoho D, Pauly JM. Sparse MRI: The application of compressed sensing for rapid MR imaging. Magn. Reson. Med 2007;58:1182–1195 doi: 10.1002/mrm.21391. [DOI] [PubMed] [Google Scholar]
- 5.Rosenkrantz AB, Mendiratta-Lala M, Bartholmai BJ, et al. Clinical Utility of Quantitative Imaging. Acad. Radiol 2015;22:33–49 doi: 10.1016/j.acra.2014.08.011. [DOI] [PMC free article] [PubMed] [Google Scholar]
- 6.Rogers W, Woodruff HC. 141.BJR 125th anniversary special feature: Review Article Radiomics: from qualitative to quantitative imaging. Br. J. Radiol 2020;1:1–13. [Google Scholar]
- 7.Zhang Z, Cho J, Wang L, et al. Blip up-down acquisition for spin- and gradient-echo imaging (BUDA-SAGE) with self-supervised denoising enables efficient T 2, T 2 *, para- and dia-magnetic susceptibility mapping. Magn. Reson. Med 2022;88:633–650 doi: 10.1002/mrm.29219. [DOI] [PubMed] [Google Scholar]
- 8.Ma D, Gulani V, Seiberlich N, et al. Magnetic resonance fingerprinting. Nature 2013;495:187–192 doi: 10.1038/nature11971. [DOI] [PMC free article] [PubMed] [Google Scholar]
- 9.Ma D, Jones SE, Deshmane A, et al. Development of high-resolution 3D MR fingerprinting for detection and characterization of epileptic lesions. J. Magn. Reson. Imaging 2019;49:1333–1346 doi: 10.1002/jmri.26319. [DOI] [PubMed] [Google Scholar]
- 10.Liao C, Wang K, Cao X, et al. Detection of lesions in mesial temporal lobe epilepsy by using MR fingerprinting. Radiology 2018;288:804–812 doi: 10.1148/radiol.2018172131. [DOI] [PubMed] [Google Scholar]
- 11.Wang K, Cao X, Wu D, et al. Magnetic resonance fingerprinting of temporal lobe white matter in mesial temporal lobe epilepsy. Ann. Clin. Transl. Neurol 2019;6:1639–1646 doi: 10.1002/acn3.50851. [DOI] [PMC free article] [PubMed] [Google Scholar]
- 12.Panda A, Obmann VC, Lo WC, et al. MR fingerprinting and ADC mapping for characterization of lesions in the transition zone of the prostate gland. Radiology 2019;292:685–694 doi: 10.1148/radiol.2019181705. [DOI] [PMC free article] [PubMed] [Google Scholar]
- 13.Hu S, Choi JY, Mcgivney D, et al. Application of Magnetic Resonance Fingerprinting in Epilepsy. 2019:42–47. [Google Scholar]
- 14.Badve C, Yu A, Dastmalchian S, et al. MR fingerprinting of adult brain tumors: Initial experience. Am. J. Neuroradiol 2017;38:492–499 doi: 10.3174/ajnr.A5035. [DOI] [PMC free article] [PubMed] [Google Scholar]
- 15.Liao C, Bilgic B, Manhard MK, et al. 3D MR fingerprinting with accelerated stack-of-spirals and hybrid sliding-window and GRAPPA reconstruction. Neuroimage 2017;162:13–22 doi: 10.1016/j.neuroimage.2017.08.030. [DOI] [PMC free article] [PubMed] [Google Scholar]
- 16.Afzali M, Mueller L, Sakaie K, et al. MR Fingerprinting with b-Tensor Encoding for Simultaneous Quantification of Relaxation and Diffusion in a Single Scan. Magn. Reson. Med 2022;88:2043–2057 doi: 10.1002/mrm.29352. [DOI] [PMC free article] [PubMed] [Google Scholar]
- 17.Cao X, Liao C, Zhong Z, et al. 3D Diffusion-prepared MRF ( 3DM ) with cardiac gating for rapid high resolution whole-brain T 1, T 2, proton density and diffusivity mapping. Proc Intl Soc Mag Reson Med 2022:0101. [Google Scholar]
- 18.Flassbeck S, Schmidt S, Bachert P, Ladd ME, Schmitter S. Flow MR fingerprinting. Magn. Reson. Med 2019;81:2536–2550 doi: 10.1002/mrm.27588. [DOI] [PubMed] [Google Scholar]
- 19.Gao Y, Han F, Zhou Z, et al. Multishot diffusion-prepared magnitude-stabilized balanced steady-state free precession sequence for distortion-free diffusion imaging. Magn. Reson. Med 2019;81:2374–2384 doi: 10.1002/mrm.27565. [DOI] [PubMed] [Google Scholar]
- 20.Gao Y, Zhou Z, Han F, Zhong X, Yang Y, Hu P. 3D isotropic resolution diffusion-prepared magnitude-stabilized bSSFP imaging with high geometric fidelity at 1.5 Tesla. Med. Phys 2020;47:3511–3519 doi: 10.1002/mp.14195. [DOI] [PubMed] [Google Scholar]
- 21.Lu L, Erokwu B, Lee G, et al. Diffusion-prepared fast imaging with steady-state free precession (DP-FISP): A rapid diffusion MRI technique at 7 T. Magn. Reson. Med 2012;68:868–873 doi: 10.1002/mrm.23287. [DOI] [PMC free article] [PubMed] [Google Scholar]
- 22.Koktzoglou I, Li D. Diffusion-prepared segmented steady-state free precession: Application to 3D black-blood cardiovascular magnetic resonance of the thoracic aorta and carotid artery walls. J. Cardiovasc. Magn. Reson 2007;9:33–42 doi: 10.1080/10976640600843413. [DOI] [PubMed] [Google Scholar]
- 23.Cervantes B, Van AT, Weidlich D, et al. Isotropic resolution diffusion tensor imaging of lumbosacral and sciatic nerves using a phase-corrected diffusion-prepared 3D turbo spin echo. Magn. Reson. Med 2018;80:609–618 doi: 10.1002/mrm.27072. [DOI] [PMC free article] [PubMed] [Google Scholar]
- 24.Zhang Q, Coolen BF, Versluis MJ, Strijkers GJ, Nederveen AJ. Diffusion-prepared stimulated-echo turbo spin echo (DPsti-TSE): An eddy current-insensitive sequence for three-dimensional high-resolution and undistorted diffusion-weighted imaging. NMR Biomed. 2017;30:1–12 doi: 10.1002/nbm.3719. [DOI] [PubMed] [Google Scholar]
- 25.Le Bihan D, Poupon C, Amadon A, Lethimonnier F. Artifacts and pitfalls in diffusion MRI. J. Magn. Reson. Imaging 2006;24:478–488 doi: 10.1002/jmri.20683. [DOI] [PubMed] [Google Scholar]
- 26.Anderson AW, Gore JC. Analysis and correction of motion artifacts in diffusion weighted imaging. Magn. Reson. Med 1994;32:379–387 doi: 10.1002/mrm.1910320313. [DOI] [PubMed] [Google Scholar]
- 27.Chang HC, Sundman M, Petit L, et al. Human brain diffusion tensor imaging at submillimeter isotropic resolution on a 3Tesla clinical MRI scanner. Neuroimage 2015;118:667–675 doi: 10.1016/j.neuroimage.2015.06.016. [DOI] [PMC free article] [PubMed] [Google Scholar]
- 28.Liao C et al. High-fidelity mesoscale in-vivo diffusion MRI through gSlider-BUDA and circular EPI with S-LORAKS reconstruction. Neuroimage 2023;275:120168 doi: 10.1016/j.neuroimage.2023.120168. [DOI] [PMC free article] [PubMed] [Google Scholar]
- 29.Conturo TE, McKinstry RC, Aronovitz JA, Neil JJ. Diffusion MRI: Precision, accuracy and flow effects. NMR Biomed. 1995;8:307–332 doi: 10.1002/nbm.1940080706. [DOI] [PubMed] [Google Scholar]
- 30.Bao Q, Liberman G, Solomon E, Frydman L. High-resolution diffusion MRI studies of development in pregnant mice visualized by novel spatiotemporal encoding schemes. NMR Biomed. 2020;33 doi: 10.1002/nbm.4208. [DOI] [PubMed] [Google Scholar]
- 31.Mesri HY, David S, Viergever MA, Leemans A. The adverse effect of gradient nonlinearities on diffusion MRI: From voxels to group studies. Neuroimage 2020;205:116127 doi: 10.1016/j.neuroimage.2019.116127. [DOI] [PubMed] [Google Scholar]
- 32.Cao X, Liao C, Iyer SS, et al. Optimized multi-axis spiral projection MR fingerprinting with subspace reconstruction for rapid whole-brain high-isotropic-resolution quantitative imaging. Magn. Reson. Med 2022;88:133–150 doi: 10.1002/mrm.29194. [DOI] [PMC free article] [PubMed] [Google Scholar]
- 33.Jiang Y, Ma D, Seiberlich N, Gulani V, Griswold MA. MR fingerprinting using fast imaging with steady state precession (FISP) with spiral readout. Magn. Reson. Med 2015;74:1621–1631 doi: 10.1002/mrm.25559. [DOI] [PMC free article] [PubMed] [Google Scholar]
- 34.Norbeck O, Sprenger T, Avventi E, et al. Optimizing 3D EPI for rapid T1-weighted imaging. Magn. Reson. Med 2020;84:1441–1455 doi: 10.1002/mrm.28222. [DOI] [PubMed] [Google Scholar]
- 35.Skare S, Andersson JLR. On the effects of gating in diffusion imaging of the brain using single shot EPI. Magn. Reson. Imaging 2001;19:1125–1128 doi: 10.1016/S0730-725X(01)00415-5. [DOI] [PubMed] [Google Scholar]
- 36.Nunes RG, Jezzard P, Clare S. Investigations on the efficiency of cardiac-gated methods for the acquisition of diffusion-weighted images. J. Magn. Reson 2005;177:102–110 doi: 10.1016/j.jmr.2005.07.005. [DOI] [PubMed] [Google Scholar]
- 37.Nguyen C, Fan Z, Sharif B, et al. In vivo three-dimensional high resolution cardiac diffusion-weighted MRI: A motion compensated diffusion-prepared balanced steady-state free precession approach. Magn. Reson. Med 2014;72:1257–1267 doi: 10.1002/mrm.25038. [DOI] [PubMed] [Google Scholar]
- 38.Alexander AL, Tsuruda JS, Parker DL. Elimination of eddy current artifacts in diffusion-weighted echo-planar images: The use of bipolar gradients. Magn. Reson. Med 1997;38:1016–1021 doi: 10.1002/mrm.1910380623. [DOI] [PubMed] [Google Scholar]
- 39.Huang F, Vijayakumar S, Li Y, Hertel S, Duensing GR. A software channel compression technique for faster reconstruction with many channels. Magn. Reson. Imaging 2008;26:133–141 doi: 10.1016/j.mri.2007.04.010. [DOI] [PubMed] [Google Scholar]
- 40.Weigel M Extended phase graphs: Dephasing, RF pulses, and echoes - Pure and simple. J. Magn. Reson. Imaging 2015;41:266–295 doi: 10.1002/jmri.24619. [DOI] [PubMed] [Google Scholar]
- 41.Gómez PA, Cencini M, Golbabaee M, et al. Rapid three-dimensional multiparametric MRI with quantitative transient-state imaging. Sci. Rep 2020;10 doi: 10.1038/s41598-020-70789-2. [DOI] [PMC free article] [PubMed] [Google Scholar]
- 42.Zijing D 3D Echo Planar Time-resolved Imaging (3D-EPTI) for ultrafast multi-parametric quantitative MRI. 2021:1–27. [DOI] [PMC free article] [PubMed]
- 43.Tamir JI, Uecker M, Chen W, et al. T2 shuffling: Sharp, multicontrast, volumetric fast spin-echo imaging. Magn. Reson. Med 2017;77:180–195 doi: 10.1002/mrm.26102. [DOI] [PMC free article] [PubMed] [Google Scholar]
- 44.Cao X, Liao C, Iyer SS, He H, Setsompop K, Zhong J. T2-gSlider: rapid high resolution T2 mapping with generalized SLIce Dithered Enhanced Resolution and model-based reconstruction. In: proceedings of the 27th Annual Meeting of ISMRM, Montreal, Canada.; 2019. p. 0312. [Google Scholar]
- 45.Liang Z Spatiotemporal imagingwith partially separable functions. Proc 4th IEEE Int Symp Biomed Imaging 2007;2:988–991. [Google Scholar]
- 46.Cao X, Wang K, Liao C, et al. Efficient T 2 mapping with blip-up/down EPI and gSlider-SMS (T 2 -BUDA-gSlider). Magn. Reson. Med 2021:1–12 doi: 10.1002/mrm.28872. [DOI] [PMC free article] [PubMed] [Google Scholar]
- 47.Zhang T, Pauly JM, Levesque IR. Accelerating parameter mapping with a locally low rank constraint. Magn. Reson. Med 2015;73:655–661 doi: 10.1002/mrm.25161. [DOI] [PMC free article] [PubMed] [Google Scholar]
- 48.Uecker M, Lai P, Murphy MJ, et al. ESPIRiT - An eigenvalue approach to autocalibrating parallel MRI: Where SENSE meets GRAPPA. Magn. Reson. Med 2014;71:990–1001 doi: 10.1002/mrm.24751. [DOI] [PMC free article] [PubMed] [Google Scholar]
- 49.Uecker M, Tamir JI, Ong F, Lustig M. The BART Toolbox for Computational Magnetic Resonance Imaging. Ismrm 2016. [Google Scholar]
- 50.Schauman S, Iyer SS, Yurt M, et al. Toward a 1-minute high-resolution brain exam - MR Fingerprinting with fast reconstruction and ML-synthesized contrasts. In: Proceedings of the International Society of Magnetic Resonance in Medicine.; 2022. p. 0053. [Google Scholar]
- 51.Iyer SS, Liao C, Li Q, et al. PhysiCal: A rapid calibration scan for B0, B1+, coil sensitivity and Eddy current mapping. Proc. Int. Soc. Magn. Reson. Med 2020:661. [Google Scholar]
- 52.Cao X, Ye H, Liao C, Li Q, He H, Zhong J. Fast 3D brain MR fingerprinting based on multi-axis spiral projection trajectory. Magn. Reson. Med 2019;82:289–301 doi: 10.1002/mrm.27726. [DOI] [PubMed] [Google Scholar]
- 53.Noguchi K, Ogawa T, Inugami A, et al. MRI of acute cerebral infarction: A comparison of FLAIR and T2-weighted fast spin-echo imaging. Neuroradiology 1997;39:406–410 doi: 10.1007/s002340050433. [DOI] [PubMed] [Google Scholar]
- 54.Haider MA, Van Der Kwast TH, Tanguay J, et al. Combined T2-weighted and diffusion-weighted MRI for localization of prostate cancer. Am. J. Roentgenol 2007;189:323–328 doi: 10.2214/AJR.07.2211. [DOI] [PubMed] [Google Scholar]
- 55.Saranathan M, Worters PW, Rettmann DW, Winegar B, Becker J. Physics for clinicians: Fluid-attenuated inversion recovery (FLAIR) and double inversion recovery (DIR) Imaging. J. Magn. Reson. Imaging 2017;46:1590–1600 doi: 10.1002/jmri.25737. [DOI] [PubMed] [Google Scholar]
- 56.Mugler JP, Brookeman JR. Three-dimensional magnetization-prepared rapid gradient-echo imaging (3D MP RAGE). Magn. Reson. Med 1990;15:152–157 doi: 10.1002/mrm.1910150117. [DOI] [PubMed] [Google Scholar]
- 57.O’Halloran R, Aksoy M, Choi ES, Bammer R. Isotropic High-Resolution 3D Diffusion Weighted SSFP Imaging with Spiral Projection Imaging. Proc. 19th Sci. Meet. ISMRM 2011;19:1961. [Google Scholar]
- 58.Liu C, Bammer R, Kim DH, Moseley ME. Self-navigated interleaved spiral (SNAILS): Application to high-resolution diffusion tensor imaging. Magn. Reson. Med 2004;52:1388–1396 doi: 10.1002/mrm.20288. [DOI] [PubMed] [Google Scholar]
- 59.Wu D, Liu D, Hsu Y, et al. Diffusion-prepared 3D gradient spin-echo sequence for improved oscillating gradient diffusion MRI. Magn. Reson. Med 2021;85:78–88 doi: 10.1002/mrm.28401. [DOI] [PubMed] [Google Scholar]
- 60.Habib J, Auer DP, Morgan PS. A quantitative analysis of the benefits of cardiac gating In practical diffusion tensor imaging of the brain. Magn. Reson. Med 2010;63:1098–1103 doi: 10.1002/mrm.22232. [DOI] [PubMed] [Google Scholar]
- 61.Terem I, Dang L, Champagne A, et al. 3D amplified MRI (aMRI). Magn. Reson. Med 2021;86:1674–1686 doi: 10.1002/mrm.28797. [DOI] [PMC free article] [PubMed] [Google Scholar]
- 62.Reese TG, Heid O, Weisskoff RM, Wedeen VJ. Reduction of eddy-current-induced distortion in diffusion MRI using a twice-refocused spin echo. Magn. Reson. Med 2003;49:177–182 doi: 10.1002/mrm.10308. [DOI] [PubMed] [Google Scholar]
- 63.Finsterbusch J Eddy-current compensated diffusion weighting with a single refocusing RF pulse. Magn. Reson. Med 2009;61:748–754 doi: 10.1002/mrm.21899. [DOI] [PubMed] [Google Scholar]
- 64.Jellison BJ, Field AS, Medow J, Lazar M, Salamat MS, Alexander AL. Diffusion Tensor Imaging of Cerebral White Matter: A Pictorial Review of Physics, Fiber Tract Anatomy, and Tumor Imaging Patterns. Am. J. Neuroradiol 2004;25:356–369. [PMC free article] [PubMed] [Google Scholar]
- 65.Ma S, Nguyen CT, Han F, et al. Three-dimensional simultaneous brain T 1, T 2, and ADC mapping with MR Multitasking. Magn. Reson. Iin Med 2019:1–17 doi: 10.1002/mrm.28092. [DOI] [PMC free article] [PubMed] [Google Scholar]
- 66.Zhang Y, Wells SA, Hernando D. Stimulated echo based mapping (STEM) of T1, T2, and apparent diffusion coefficient: validation and protocol optimization. Magn. Reson. Med 2019;81:167–181 doi: 10.1002/mrm.27358. [DOI] [PMC free article] [PubMed] [Google Scholar]
- 67.Liao C, Cao X, Iyer SS, et al. Mesoscale myelin-water fraction and T1/T2/PD mapping through optimized 3D ViSTa-MRF and stochastic reconstruction with preconditioning. Ismrm 2022;2:0365 doi: 10.1002/mrm.28509.2. [DOI] [Google Scholar]
- 68.Zhou Z, Li Q, Liao C, et al. Optimized three-dimensional ultrashort echo time: Magnetic resonance fingerprinting for myelin tissue fraction mapping. Hum. Brain Mapp 2023. doi: 10.1002/hbm.26203. [DOI] [PMC free article] [PubMed] [Google Scholar]
- 69.Perlman O, Farrar CT, Heo HY. MR fingerprinting for semisolid magnetization transfer and chemical exchange saturation transfer quantification. NMR Biomed. 2022:1–22 doi: 10.1002/nbm.4710. [DOI] [PMC free article] [PubMed] [Google Scholar]
- 70.Hilbert T, Xia D, Block KT, et al. Magnetization transfer in magnetic resonance fingerprinting. Magn. Reson. Med 2020;84:128–141 doi: 10.1002/mrm.28096. [DOI] [PMC free article] [PubMed] [Google Scholar]
- 71.Wang CY, Coppo S, Mehta BB, Seiberlich N, Yu X, Griswold MA. Magnetic resonance fingerprinting with quadratic RF phase for measurement of T2* simultaneously with δf, T1, and T2. Magn. Reson. Med 2019;81:1849–1862 doi: 10.1002/mrm.27543. [DOI] [PMC free article] [PubMed] [Google Scholar]
- 72.Li Q, Cao X, Ye H, Liao C, He H, Zhong J. Ultrashort echo time magnetic resonance fingerprinting (UTE-MRF) for simultaneous quantification of long and ultrashort T 2 tissues. Magn. Reson. Med 2019;82:1359–1372 doi: 10.1002/mrm.27812. [DOI] [PubMed] [Google Scholar]
- 73.Wyatt CR, Barbara TM, Guimaraes AR. T1ρ magnetic resonance fingerprinting. NMR Biomed. 2020;33:1–12 doi: 10.1002/nbm.4284. [DOI] [PMC free article] [PubMed] [Google Scholar]
- 74.Sharafi A, Medina K, Zibetti MWV, et al. Simultaneous T1, T2, and T1ρ relaxation mapping of the lower leg muscle with MR fingerprinting. Magn. Reson. Med 2021;86:372–381 doi: 10.1002/mrm.28704. [DOI] [PMC free article] [PubMed] [Google Scholar]
- 75.Dietrich BE, Brunner DO, Wilm BJ, et al. A field camera for MR sequence monitoring and system analysis. Magn. Reson. Med 2016;75:1831–1840 doi: 10.1002/mrm.25770. [DOI] [PubMed] [Google Scholar]
- 76.Stockmann JP, Arango NS, Witzel T, et al. A 31-channel integrated “AC/DC” B 0 shim and radiofrequency receive array coil for improved 7T MRI. Magn. Reson. Med 2022;87:1074–1092 doi: 10.1002/mrm.29022. [DOI] [PMC free article] [PubMed] [Google Scholar]
- 77.Liao C, Bilgic B, Tian Q, et al. Distortion-free, high-isotropic-resolution diffusion MRI with gSlider BUDA-EPI and multicoil dynamic B 0 shimming. Magn. Reson. Med 2021;86:791–803 doi: 10.1002/mrm.28748. [DOI] [PMC free article] [PubMed] [Google Scholar]
- 78.Liao C, Stockmann J, Cao X, et al. Flexible use of AC / DC coil for eddy-currents and concomitant fields mitigation with applications in diffusion-prepared non- Cartesian sampling. Proc. 31st Annu. Meet. ISMRM, Toronto, Canada. 2023:1236. [Google Scholar]
- 79.Lee PK, Watkins LE, Anderson TI, Buonincontri G, Hargreaves BA. Flexible and efficient optimization of quantitative sequences using automatic differentiation of Bloch simulations. Magn. Reson. Med 2019;82:1438–1451 doi: 10.1002/mrm.27832. [DOI] [PMC free article] [PubMed] [Google Scholar]
Associated Data
This section collects any data citations, data availability statements, or supplementary materials included in this article.