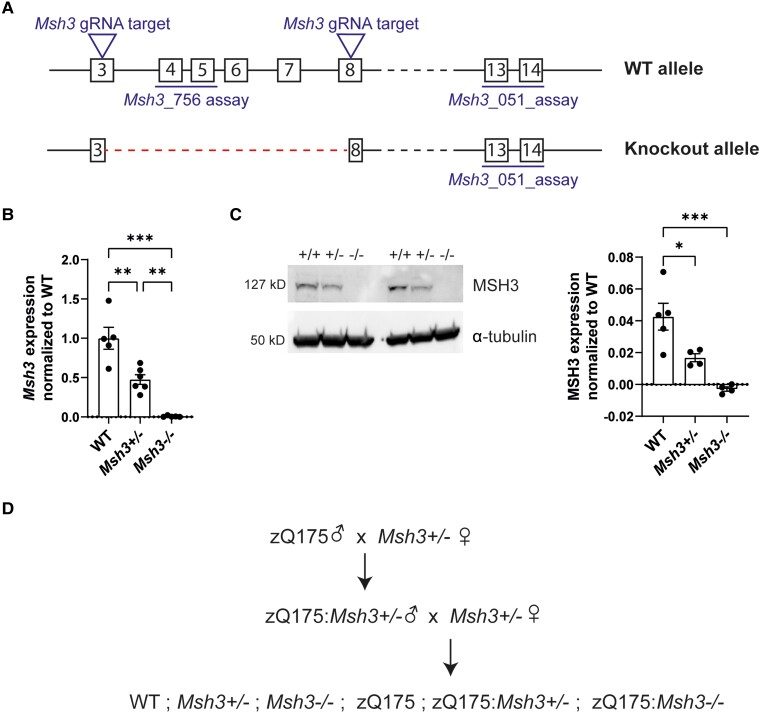
Figure 1.
Characterization of the Msh3 knockout line. (A) Msh3 knockout allele generation by CRISPR/Cas9 showing the position of guide RNAs (gRNA) targeting Msh3 exons 3 and 8 and the position of the quantitative PCR assays. (B) Expression of the Msh3 mRNA was confirmed, using a quantitative PCR assay with primers in the deleted region (Msh3_756), in the cortex of heterozygous Msh3+/− and homozygous Msh3−/− mice at 8 weeks of age (n= 5/genotype). (C) Western blotting with an MSH3 antibody showed that MSH3 levels were decreased in Msh3+/− heterozygotes and absent in Msh3−/− homozygotes. MSH3 levels were quantified by normalizing to α-tubulin (n = 5/wild-type, n = 4/Msh3+/− and Msh3−/−). (D) Schematic of the genetic cross performed to generate the six experimental genotypes as littermates. One-way ANOVA with Tukey's post hoc test. Error bars = standard error of the mean (SEM). *P ≤ 0.05, **P ≤ 0.01, ***P ≤ 0.001. The test statistic, degrees of freedom and P-values are summarized in Supplementary Table 3. Full-length blots are shown in Supplementary Fig. 5. WT = wild-type.

