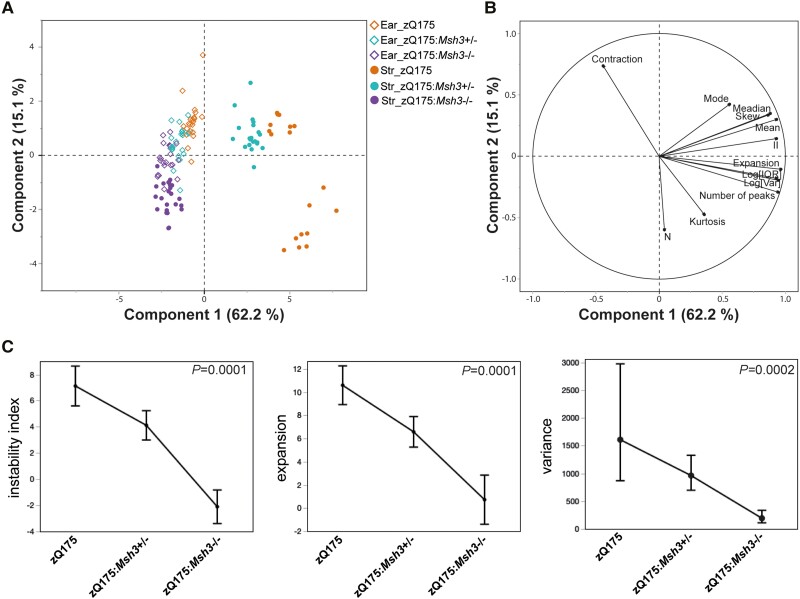
Figure 4.
Statistical analysis of the effect of heterozygosity and homozygosity for Msh3 knockout on somatic CAG repeat instability in the striatum. (A and B) Scores and loading plots from the principal component analysis of all summary statistics using ear and striatal data. The plots indicate the statistical variables contributing to the differences seen between genotypes: contraction, mode, median, skew, mean, expansion. II = instability index; log(IQR) = log interquartile range; log(var) = log variance, kurtosis; n = sum of peak heights. (C) Least squares means plots of instability index, expansion and variance summary statistics showing means (geometric means for variance) adjusted for ear and 95% confidence intervals for striatum across genotype. These data again confirm the significant effect of Msh3 genotype on instability, expansion and variation. P-value of effect test (genotype) shown.

