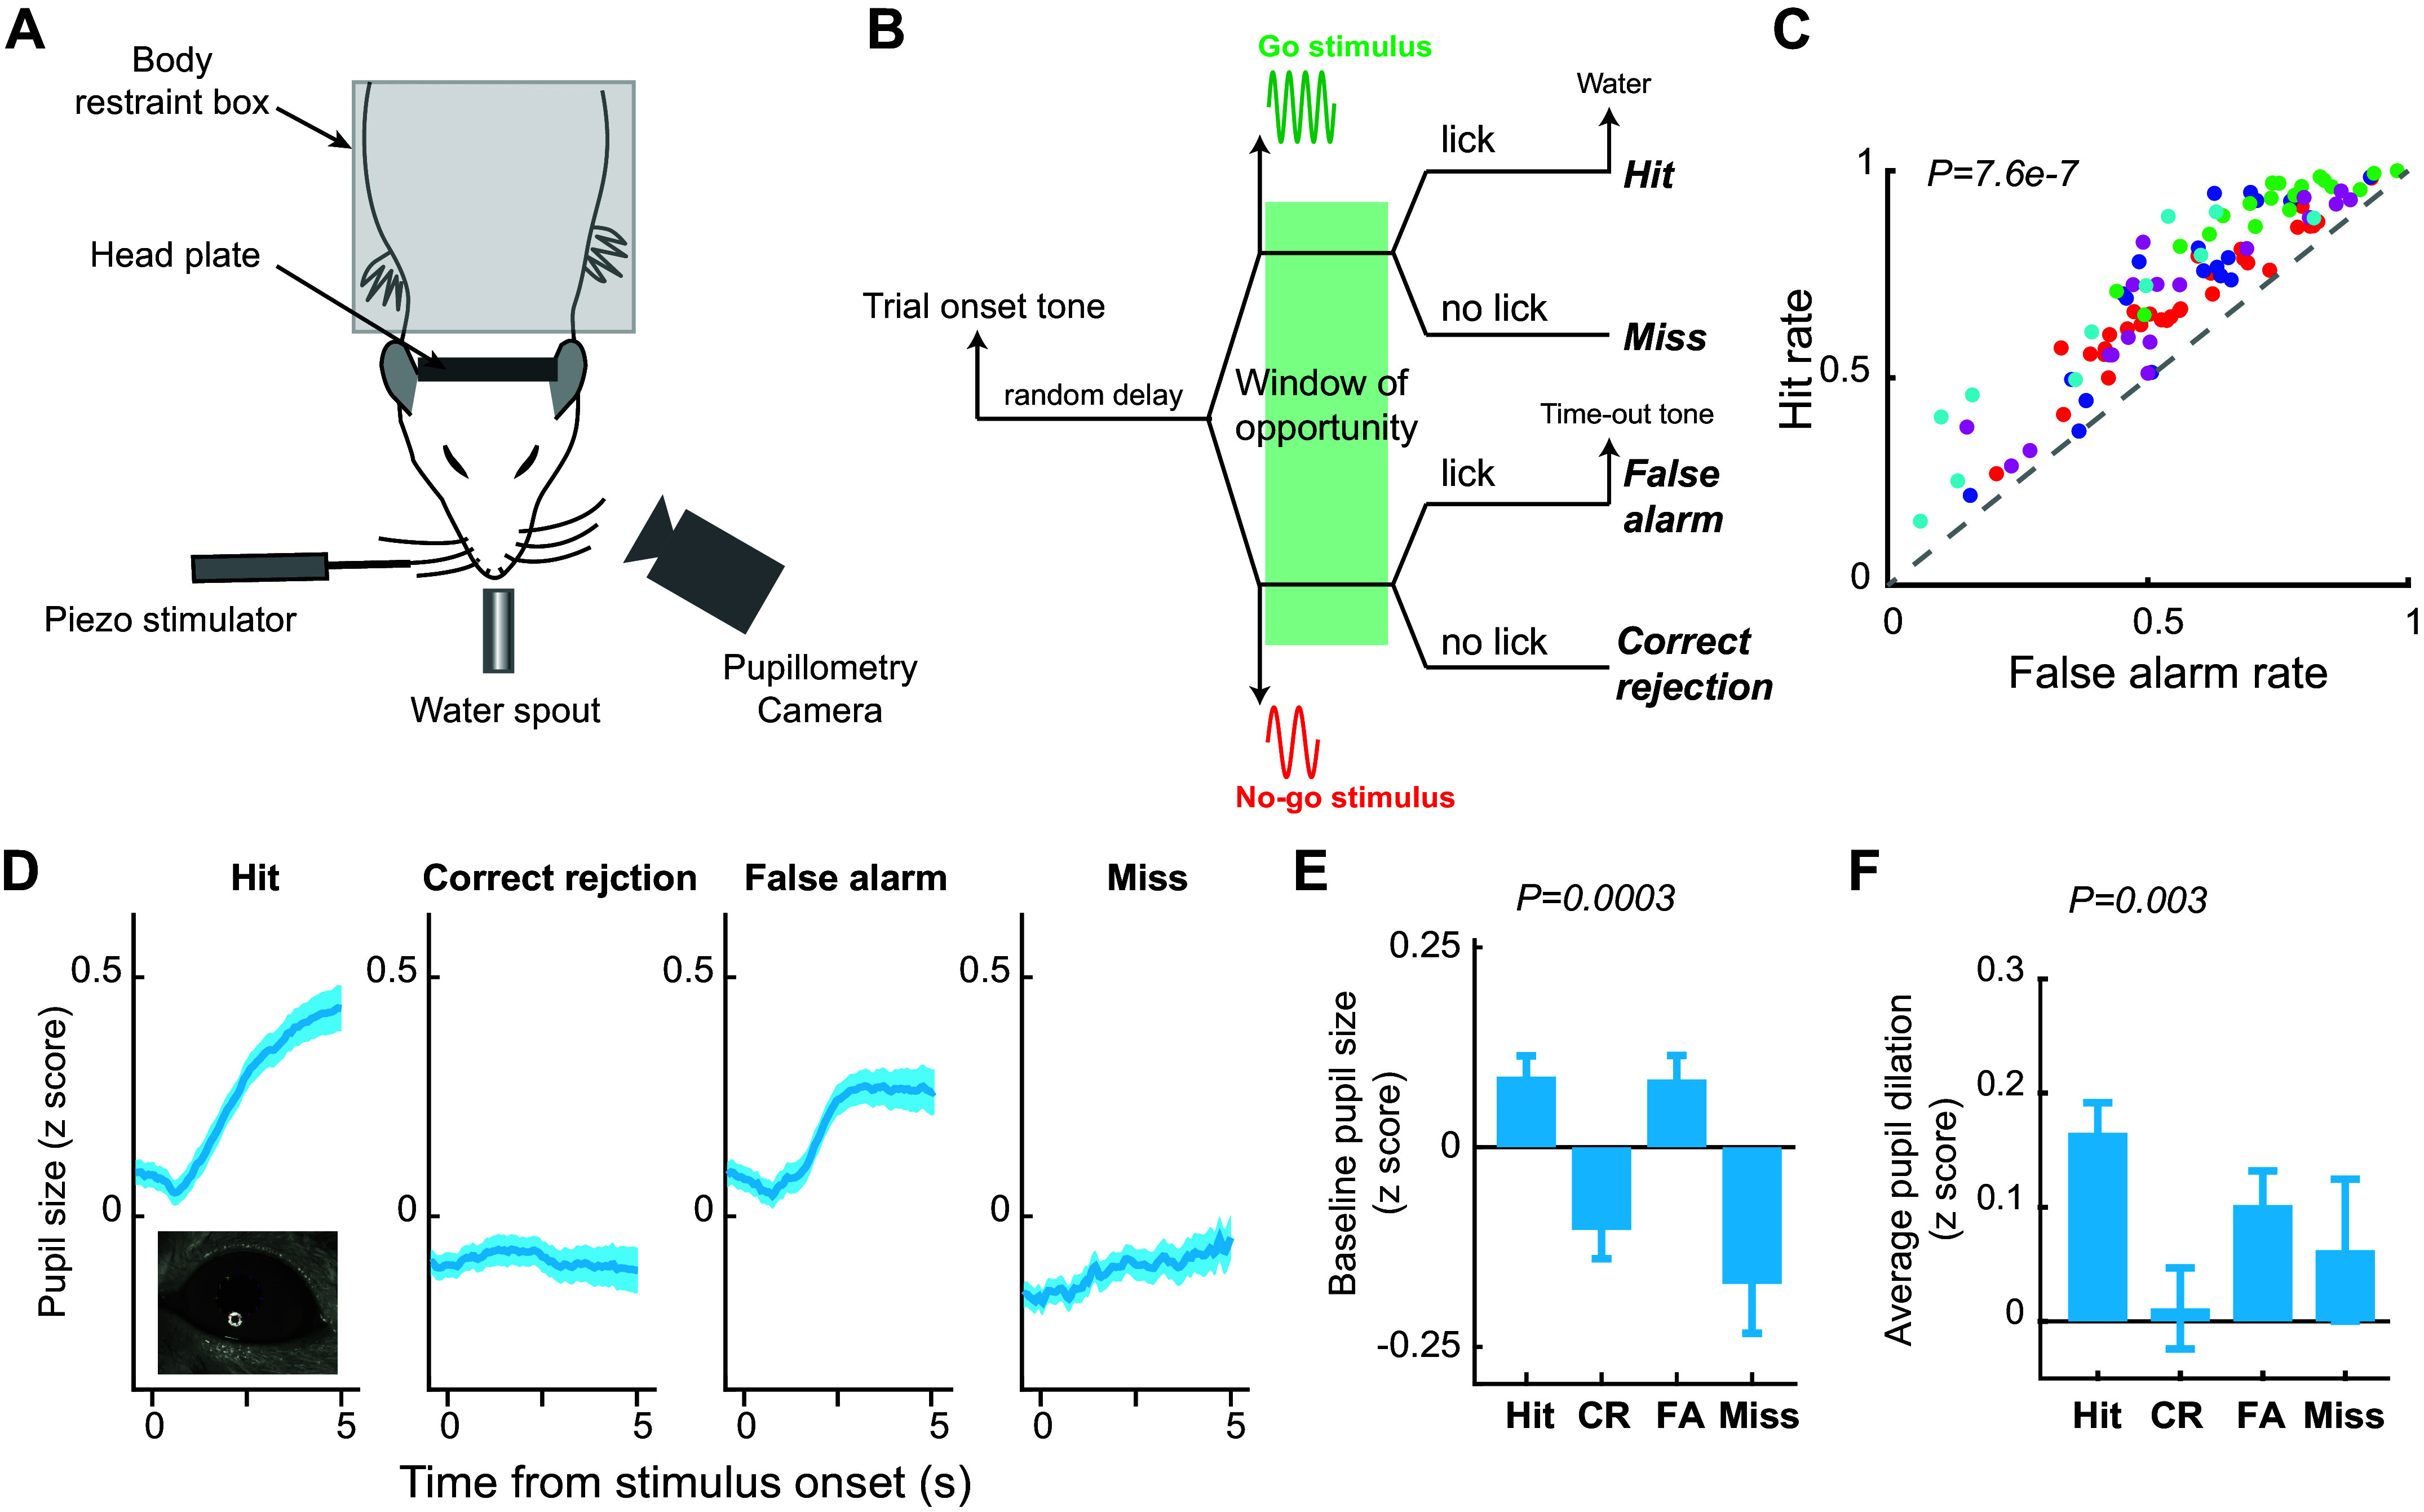
Figure 1.

Behavioral performance and pupil dynamics during a tactile decision-making task. A: experimental setup. B: the diagram of a Go/No-go perceptual decision-making task. C: hit rate was significantly higher than false alarm rate in sessions where the probability of the Go stimulus is 50%. Student’s t test. Each color denotes an animal. 103 sessions from five animals. D: pupil dynamics around stimulus presentation associated with the four behavioral outcomes. E: baseline pupil size associated with the four behavioral outcomes. ANOVA test. F: pupil dilation associated with the four behavioral outcomes. ANOVA test. 56 sessions from five animals.
