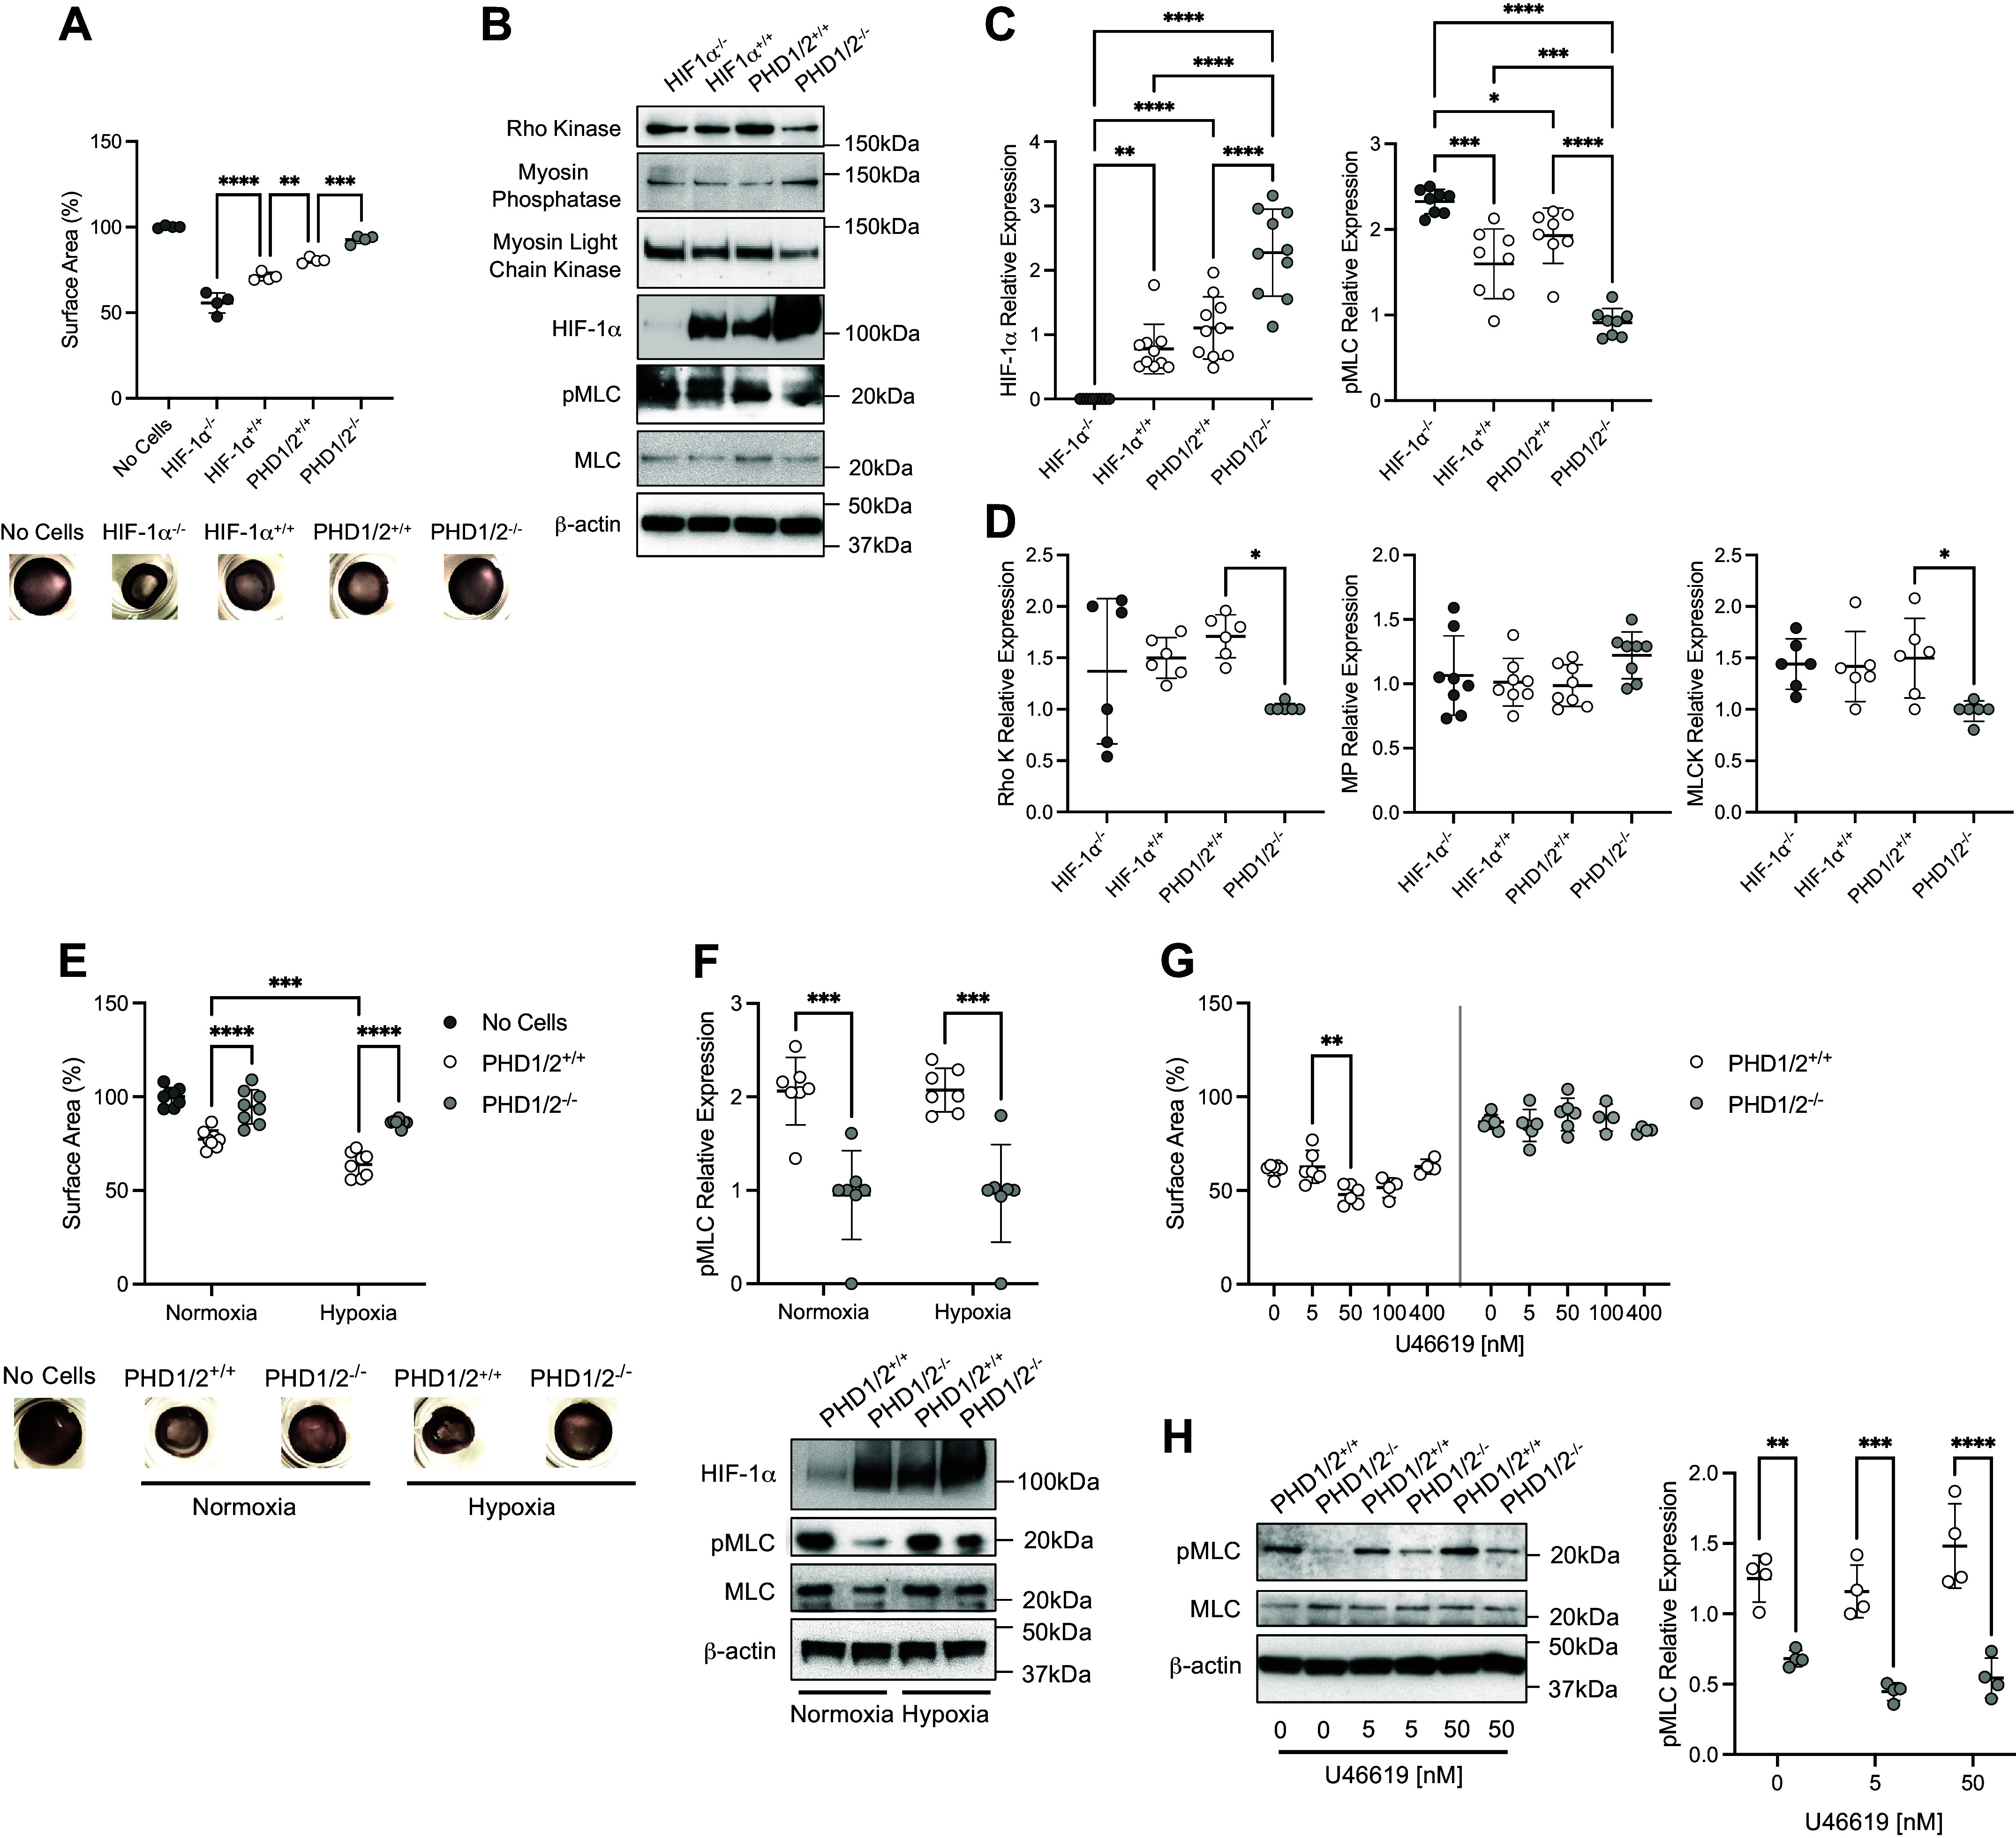
Figure 3.

Vascular tone is decreased in PHD1/2−/− PASMC. A: collagen gel contraction assays of isolated PASMC from SM22α-HIF-1α and SM22α-PHD1/2 mice (n = 4 replicate experiments performed in triplicate). Representative images of collagen gels are shown. B: protein expression profile of isolated HIF-1α and PHD1/2 PASMC. C: quantification of HIF-1α and pMLC expression in isolated PASMC (n = 8–10 replicate experiments). D: quantification of Rho kinase (Rho K), myosin phosphatase (MP), and myosin light chain kinase (MLCK) expression in PASMC (n = 6–8 replicate experiments). E: collagen gel contraction assays of PHD1/2 PASMC under normoxic and hypoxic (5% O2, 18 h) conditions (n = 8 replicate experiments performed in triplicate). Representative images of collagen gels are shown. F: quantification of pMLC expression in PHD1/2 PASMC under normoxic and hypoxic conditions (n = 7 replicate experiments). G: collagen gel contraction assays of PHD1/2 PASMC exposed to U46619, a Thromboxane A2 agonist (n = 4–6 replicate experiments performed in triplicate). H: quantification of pMLC expression in PHD1/2 PASMC exposed to U46619 (n = 4 replicate experiments). Graphs represent the means ± SD, *P < 0.05, **P < 0.01, ***P < 0.001, ****P < 0.0001, as indicated. For the collagen gel contraction assays, all samples are statistically significant in comparison to “No Cells” control. P values were measured by one-way ANOVA (A, C, D) and two-way ANOVA (E, F, G, H). HIF-1α, hypoxia-inducible factor-1α; PHD, prolyl hydroxylase domain; PASMC, pulmonary artery smooth muscle cell.
