
Figure 3. LN resident and migratory DCs are susceptible to HIV infection in vitro.
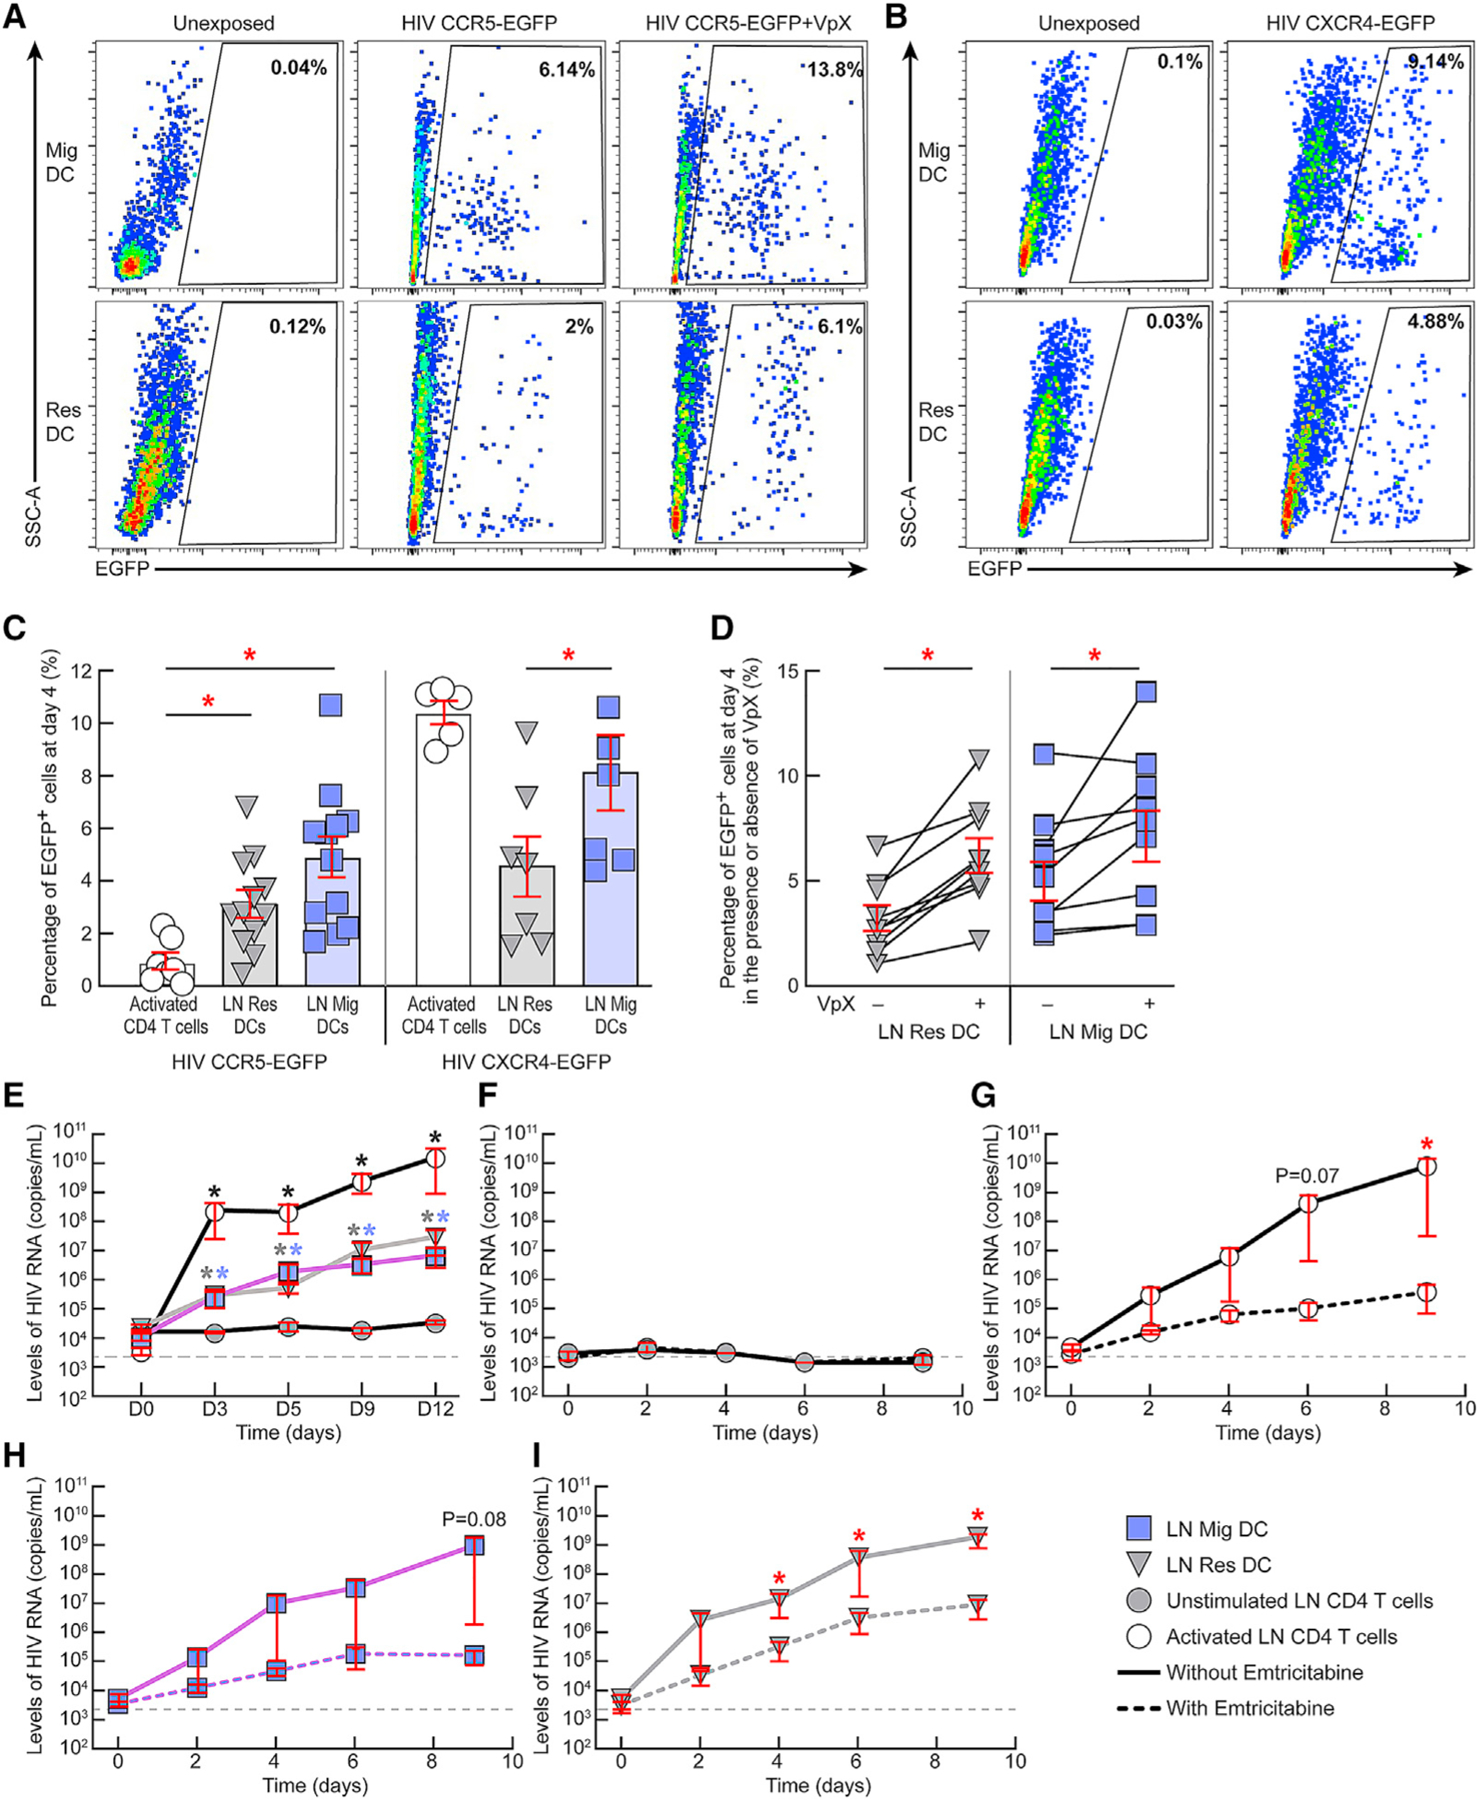
(A and B) Representative flow cytometry profiles of LN resident and migratory DCs isolated from a representative HIV-uninfected individual showing their relative susceptibility to (A) CCR5-tropic HIV-derived vector encoding for EGFP in the presence or absence of SAMHD1-modulating factor, i.e., Vpx at day 4 post-exposure or (B) to CXCR4-tropic HIV-derived vector encoding for EGFP.
(C) Percentages of EGFP+ LN DCs at day 4 post-exposure to either CCR5-tropic (N = 12) or CXCR4-tropic (N = 7) HIV-derived vectors. Activated LN CD4 T cells were added as controls (N = 5).
(D) Percentage of EGFP+ LN DCs at day 4 post-exposure to CCR5-tropic HIV-derived vector encoding for EGFP in the presence or absence of Vpx (N = 9).
(E) Levels of HIV RNA (copies/mL) in culture supernatants of unstimulated LN CD4 T cells, activated LN CD4 T cells, LN migratory DCs, and LN resident DCs of HIV-uninfected individuals exposed to HIV Ba-L (N = 3).
(F–I) Levels of HIV RNA (copies/mL) in culture supernatants of unstimulated LN CD4 T cells (F), activated LN CD4 T cells (G), LN migratory DCs (H), and LN resident DCs (I) of HIV-uninfected individuals exposed to HIV Ba-L in the presence or absence of emtricitabine (N = 3).
Red bars correspond to mean ± SEM (C–I). Red stars indicate statistical significance (*p < 0.05) of intra-group comparisons (C and D) or of conditions cultured without emtricitabine compared with conditions with emtricitabine (G and I). Black, gray, and violet stars indicate statistical significance (*p < 0.05) of activated CD4 T cells, LN resident, and migratory DCs, respectively, compared with the levels of unstimulated CD4 T cells at the corresponding time points (E). Wells with detectable HIV-1 RNA (≥2,000 HIV-1 RNA copies/mL) were referred to as HIV-1 RNA-positive wells (E–I). Gray dashed lines (E–I) represent the limit of detection. Statistical significance (p values) was obtained using one-way ANOVA (Kruskal-Wallis test) followed by Wilcoxon matched-pairs two-tailed signed rank test (C–E) or following a one-tailed ratio paired t test (F–I). “Res DC” corresponds to LN resident DCs and “Mig DC” corresponds to LN migratory DCs.