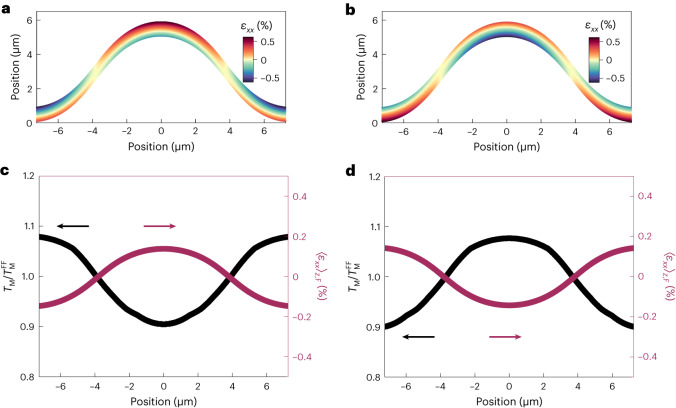
Fig. 4. Flexure strain and anisotropy model.
a,b, Non-uniform strain distribution, εxx, in the α-Fe2O3 layer as a function of thickness and length, across folds in buffered AFM membranes (type C) with α-Fe2O3-side-facing-up (a) and buffer-side-facing-up (b) configurations. Membrane thickness has been exaggerated to aid the visualization of the non-uniform strain distribution as a function of thickness. The neutral line (εxx ≈ 0), indicated in yellow, is located at very different positions in a and b relative to the middle of the α-Fe2O3 layer, resulting in strong variations in the average and maximum strains in the AFM layer. c,d, Evolution of the thickness-averaged strain in the α-Fe2O3 layer, 〈εxx〉z,F, and the corresponding local for the two configurations given in a (c) and b (d). Strain-driven modulation of the local TM was obtained from the model developed in the literature30. Here larger and smaller than unity refers to the elevation and suppression of the local Morin temperature, respectively, and therefore the magnetic anisotropy, relative to the flat far-field regions.

