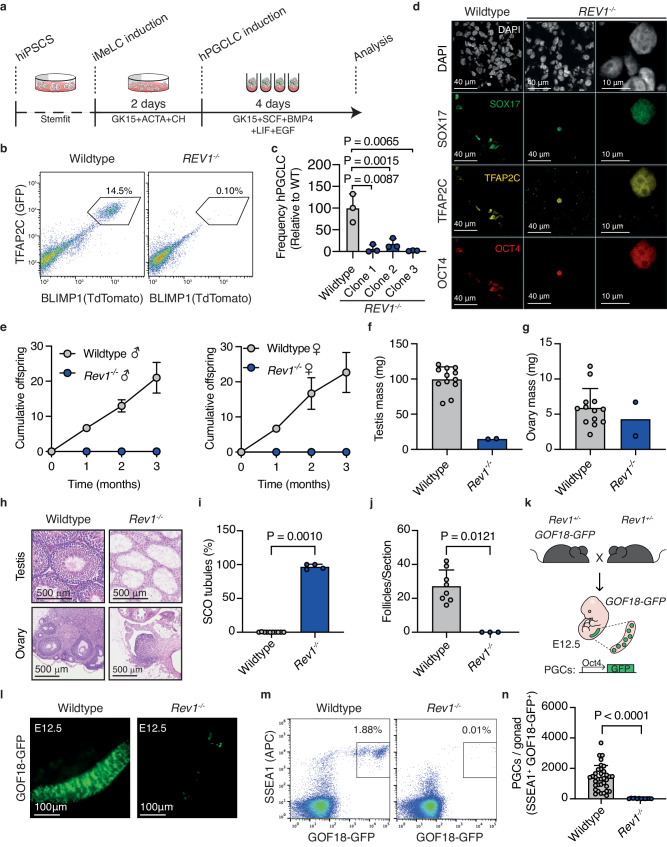
Fig. 1. REV1-deficiency leads to defects in hPGCLC induction and infertility in mice.
a Schematic of the hPGCLC differentiation protocol adapted from47. b Representative flow cytometry plots and (c) quantification of hPGCLC frequency at day 4 from three independent wildtype or REV1-/- clones differentiated three times. (Data represent mean and s.d. P values were calculated by a two-tailed Mann–Whitney U-test). d Representative images of wildtype and REV1-/- aggregates immunostained for SOX17, TFAP2C and OCT4. e Offspring when male (left) and female (right) wildtype or Rev1-/- mice were mated with wildtype mates of the opposite sex (n = 6 mice per genotype, 3 per sex. Data represent mean and s.d. P values were calculated by a two-tailed Mann–Whitney U-test). f Quantification of testis mass of 8−12-week-old wildtype and Rev1-/- mice (n = 12, 2, left to right. Data represent mean and s.d. P values were calculated by a two-tailed Mann–Whitney U-test). g Quantification of ovary mass from 8−12-week-old wildtype and Rev1-/- mice (n = 13, 2, left to right. Data represent mean and s.d. P values were calculated by a two-tailed Mann–Whitney U-test). h H&E-stained ovaries and testes seminiferous tubules from 8−12-week-old wildtype and Rev1-/- mice. i Quantification of SCO tubules per section of testis of 8−12-week-old wildtype and Rev1-/- mice (n = 10 and 4 animals, left to right. Data represent mean and s.d. P values were calculated by a two-tailed Mann–Whitney U-test). j Quantification of follicles per section of ovary from 8−12-week-old wildtype and Rev1-/- mice (n = 8 and 3 animals, left to right). Data represent mean and s.d. P values were calculated by a two-tailed Mann–Whitney U-test. k Schematic for generation of Rev1-/- embryos harboring the GOF18-GFP reporter. l GFP fluorescence images of gonads from wildtype and Rev1-/- E12.5 embryos. m Representative flow cytometry plots and (n) quantification of PGCs by flow cytometry from wildtype and Rev1-/- E12.5 embryos (n = 35 and 12, left to right. Data represent mean and s.d. P values were calculated by a two-tailed Mann–Whitney U-test).

