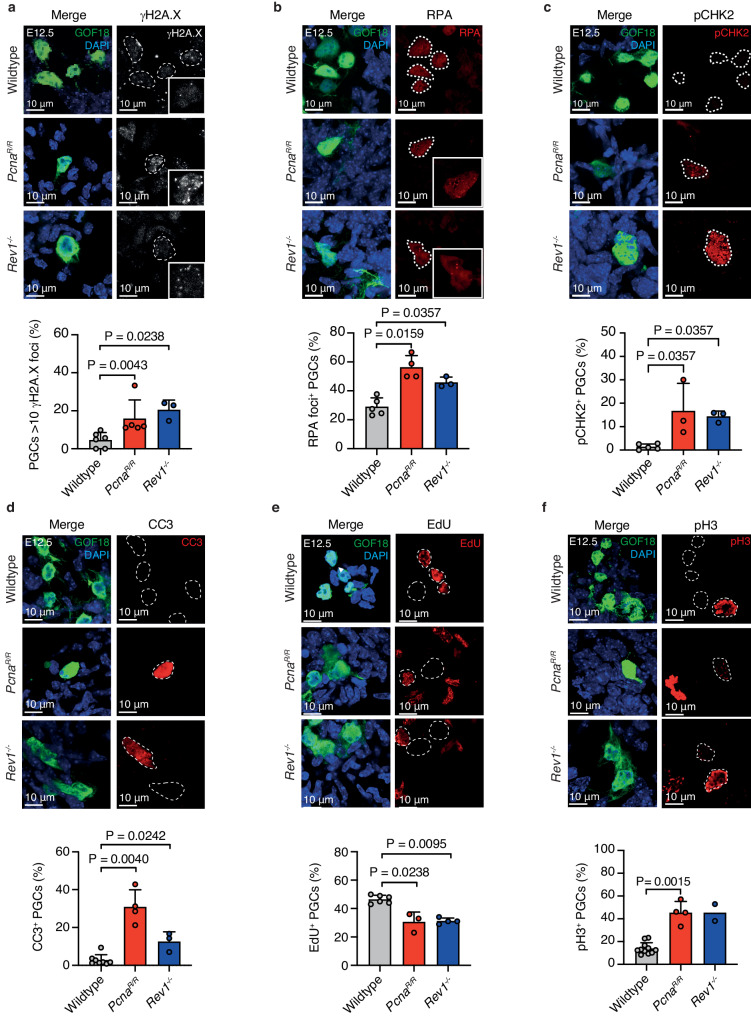
Fig. 4. Genome instability and cell cycle abnormalities in PcnaR/R and Rev1-/- PGCs.
a Top: Representative images of ɣ-H2A.X foci in the nucleus of PGCs (GOF18-GFP+) at E12.5. Bottom: Frequency of PGCs with >10 ɣ-H2A.X foci per nucleus (n = 6, 5 and 3, left to right. Data represent mean and s.d. P values were calculated by a two-tailed Mann–Whitney U-test). b Top: Representative images of RPA foci in the nucleus of PGCs at E12.5. Bottom: Frequency of PGCs with RPA foci (n = 5, 4 and 3, left to right. Data represent mean and s.d. P values were calculated by a two-tailed Mann–Whitney U-test). c Top: Representative images of E12.5 gonads stained for phosphorylation of CHK2 kinase at residue Thr68 (pCHK2). Bottom: Frequency of PGCs that stain positive for pCHK2 (n = 5, 3 and 3, left to right. Data represent mean and s.d. P values were calculated by a two-tailed Mann–Whitney U-test). d Top: Representative images of E12.5 gonads stained for cleaved-Caspase-3 (CC3) and GFP. Bottom: Frequency of PGCs that stain positive for CC3 (n = 8, 4 and 3, left to right. Data represent mean and s.d. P values were calculated by a two-tailed Mann–Whitney U-test). e Top: Representative images of E12.5 gonads stained for EdU and GFP. Bottom: Frequency of PGCs that stain positive for EdU (n = 3 per genotype. Data represent mean and s.d. P values were calculated by a two-tailed Mann–Whitney U-test). f Top: Representative images of E12.5 gonads stained for phosphorylated-histone-H3 (pH3) and GFP. Bottom: Frequency of PGCs that stain positive for pH3 (n = 11, 4 and 2, left to right. Data represent mean and s.d. P values were calculated by a two-tailed Mann–Whitney U-test).

