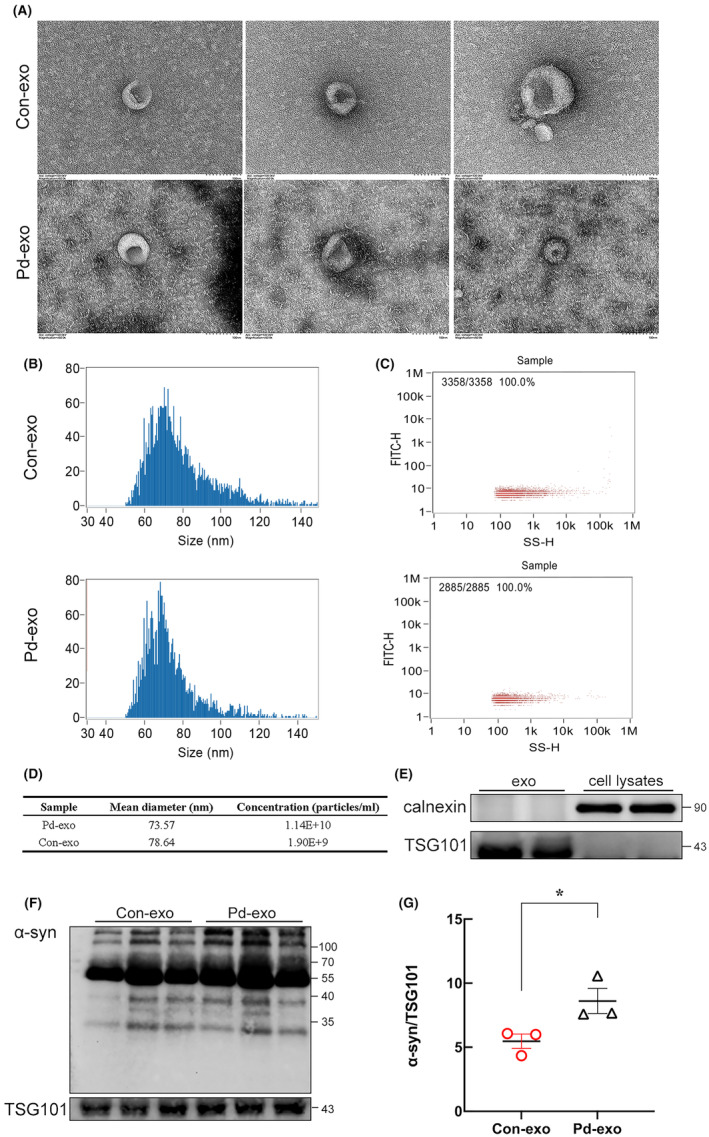
FIGURE 1.

Increased α‐synuclein egress in plasma exosomes derived from patients with PD. (A) Representative transmission electron microscopy observation of exosomes isolated from human plasma, Scale bar = 100 nm. (B) Nanotracker particle analysis determined the size of exosomes isolated from human plasma. (C) Nanotracker particle analysis determined the concentration of exosomes isolated from human plasma. (D) Representative data on particle size and concentration of exosomes. (E) Western blot shows the presence of exosomal marker TSG101 and the absence of negative marker calnexin in plasma‐derived exosomes. (F) Immunoblots show the levels of oligomeric and monomeric exosomal α‐syn expression. (G) The quantitative data of oligomeric exosomal α‐syn. Bolts were probed for TSG101 as a loading control. *p < 0.05.
