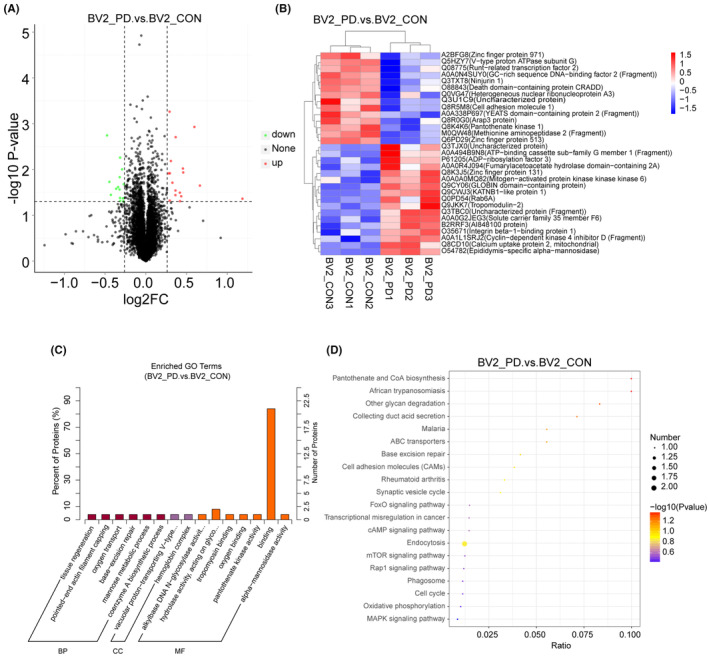
FIGURE 2.

Quantitative proteome analysis of plasma exosome‐treated microglia. (A) Differential protein volcano map analysis of PD‐exo‐treated microglia versus Con‐exo‐treated microglia. (B) The hierarchical clustering heat map indicates the candidates for differentially expressed proteins in exosome‐treated microglia. (C) GO analysis of cellular components of all identified proteins in exosomes‐treated microglia. (D) KEGG analysis of cellular components of all identified proteins in exosomes‐treated microglia.
