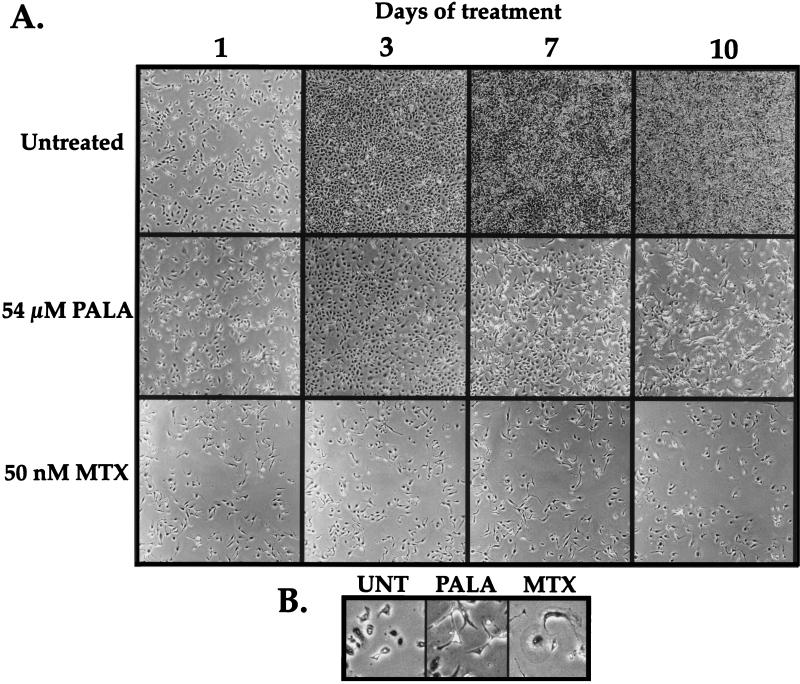
FIG. 2.
Growth potential and morphology of HT1080 cells treated with antimetabolites. (A) Photographs of HT1080 cells grown under normal conditions or treated with 54 μM PALA or 50 nM MTX. The same field of cells for each treatment was photographed every 24 h for 10 days. (b) Magnified view of cells pictured in panel A, showing differences in cell morphology after the different treatments. Untreated cells at day 1 (UNT) are shown for comparison, as these cells were at the same approximate density as the pictured PALA- and MTX-treated cells at day 10.

