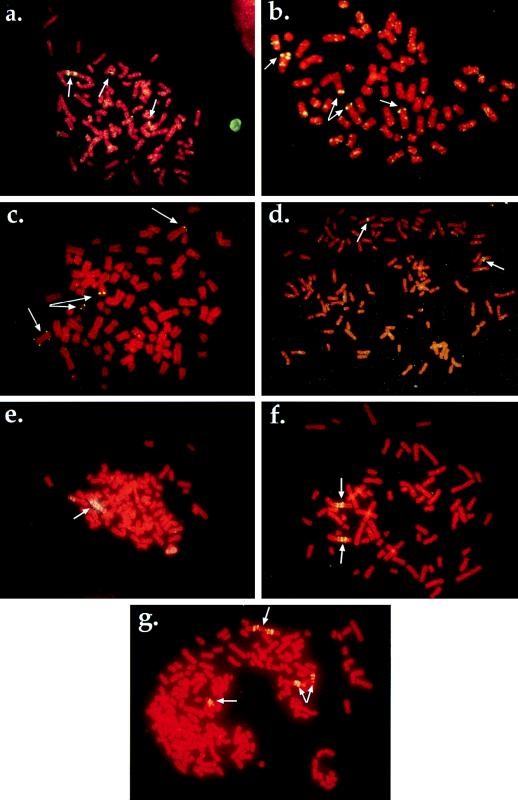
FIG. 4.
Mechanisms of resistance to PALA and MTX in HT1080 cells. (a) Amplification of the CAD locus in PALAr HT1080 cells. Arrows indicate localization of the CAD locus to two unamplified chromosomal sites and one amplified region. Metaphase was produced from a population of PALAr HT1080 but is representative of the amplification observed in a majority of the cells in the population. (b) Resistance to PALA mediated by aneuploidy. Arrows indicate the presence of four copies of a chromosome containing CAD sequences. (c) Amplification in HT1080 due to chromosome breakage. Arrows indicate that this PALAr clone contains two apparently normal chromosomes 2 containing CAD sequences. Also present are a copy of an isochromosome 2p and a small chromosomal fragment bearing CAD sequences. (d) Untreated HT1080 cell metaphase. Arrows indicate the localization of the DHFR probe to two single chromosomal sites. (e) Localization of the DHFR probe to an expanded chromosomal array. Metaphase was derived from a pool of cells treated with araC for 4 h and resistant to 50 nM MTX. Similar structures were observed in all pools examined (six of six). (f) Multiple copies of the DHFR locus on two different chromosomes in a clone derived from cells treated with 10 μM VP16 and resistant to 100 nM MTX. This metaphase is representative of amplification observed in other independent clones derived from different DNA breakage treatments (six of seven examined). (g) Evidence of ongoing genetic instability. The same cells shown in panel f were subjected to two rounds of stepwise selection, first at 200 nM MTX and then at 400 nM MTX. The metaphase shown was derived from a pool of cells resistant to 400 nM MTX. Arrows indicate regions of amplification, with one site (top) consisting of an inverted duplication that was not present in the initial clone (see panel f). This figure was compiled by using Adobe Photoshop 3.0.5 (Adobe Systems Inc.).

