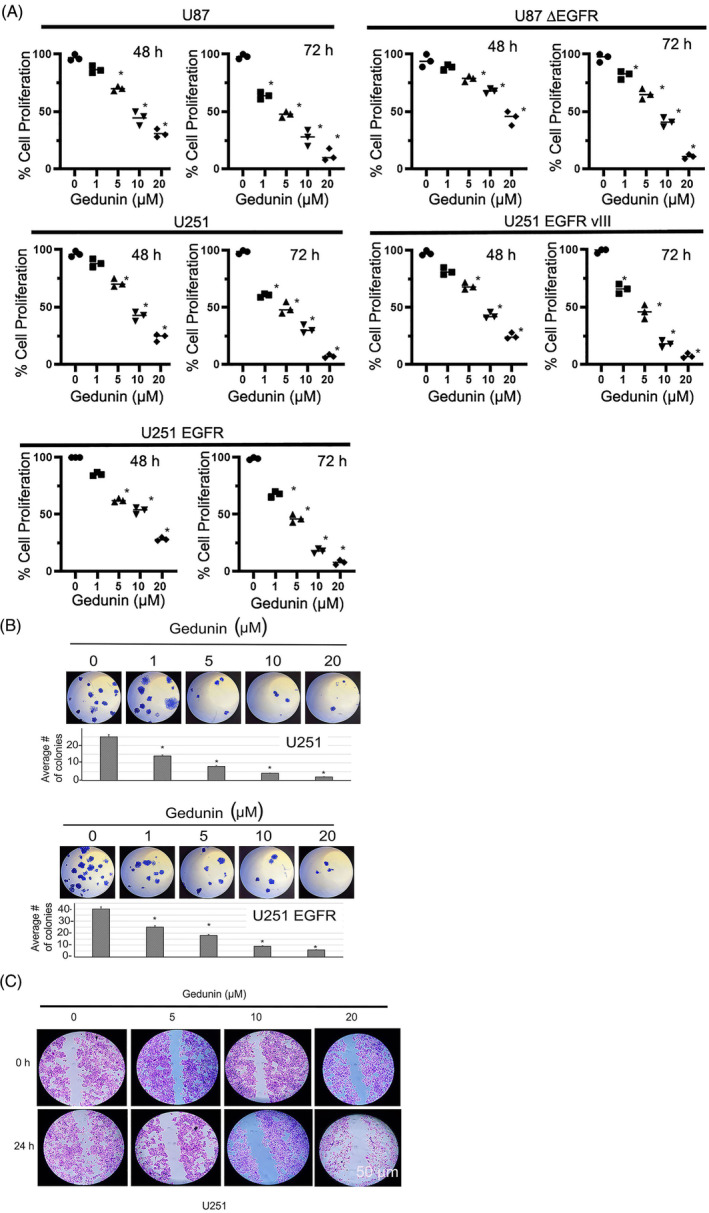
FIGURE 3.

The effects of gedunin (1–20 μM) on the proliferation of U87 MG, U87 EGFR vIII, U251, U251 EGFR vIII, and U251 EGFR cells as measured by MTT assay after 48–72 h of treatment. The data is represented as the mean ± SEM. *Denotes significance (p < .05) in proliferation. Experiments were performed in three biological replicates. (B) The effects of gedunin (1–20 μM) on colony assay in U251 glioblastoma cell line. There is a concentration‐dependent decrease in colonies formed with treatment compared to control untreated cells. *Denotes significant (p < .05) difference in colonies of treated cells compared to untreated control cells. (C) The effects of gedunin (5–20 μM) on wound healing assay in U251 glioblastoma cell lines. Gedunin decreases the ability to migrate and close the wound. Bar scale 50 μm. Experiments were performed in three biological replicates.
