
FIGURE 4.
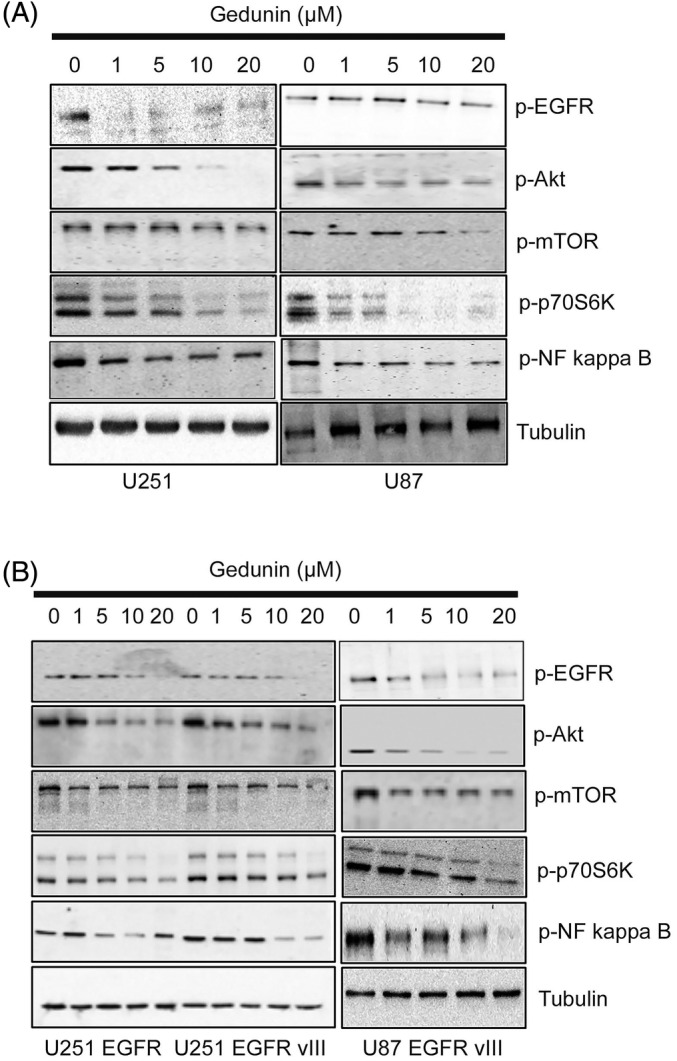
The effects of gedunin (0–20 μM) on the protein expression profile of phospho EGFR, Akt, NF kappa B, and p‐mTOR in U87 and U251 glioblastoma cell lines. The cells were treated with gedunin for 16 h. These figures are representative of Western blot images of three biological replicates. (B) The effects of gedunin (0–20 μM) on the protein expression profile of phospho EGFR, Akt, NF kappa B, and p‐mTOR in U87 EGFR vIII, U251 EGFR vIII, and U87 EGFR vIII glioblastoma cell lines. The cells were treated with gedunin for 16 h. These figures are representative of Western blot images of three biological replicates.