
Fig. 5.
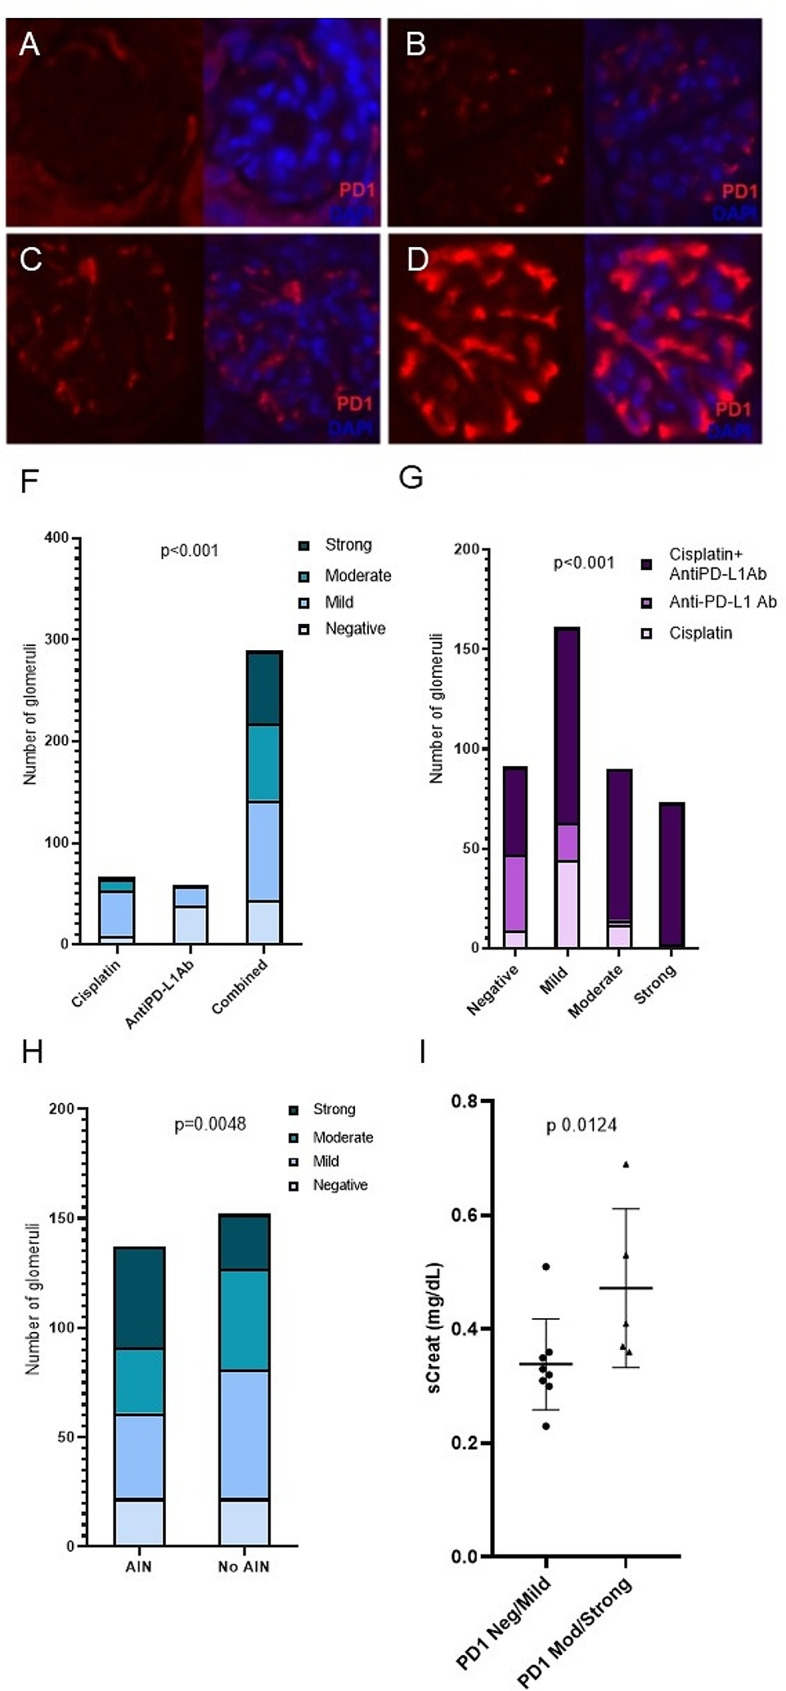
PD-1 glomerular immunofluorescence staining (red) was evaluated at 20x and semiquantitatively scored into 4 categories: absent (panel A), mild (panel B), moderate (panel C), and strong (panel D). Nuclei were counterstained with DAPI (blue). Panel F shows the distribution of the grade of PD-1 staining across the different treatments received by mice. Panel G shows the distribution of the different treatments administered to mice according to the grade of PD-1 glomerular staining. Panel H shows the proportion of the different grades of PD-1 staining in mice treated with cisplatin plus anti-PD-L1 antibodies depending on the presence of AIN. Panel I shows the mean serum creatinine found in mice with predominance of PD-1 negative or mild staining compared to those with predominantly moderate or strong staining