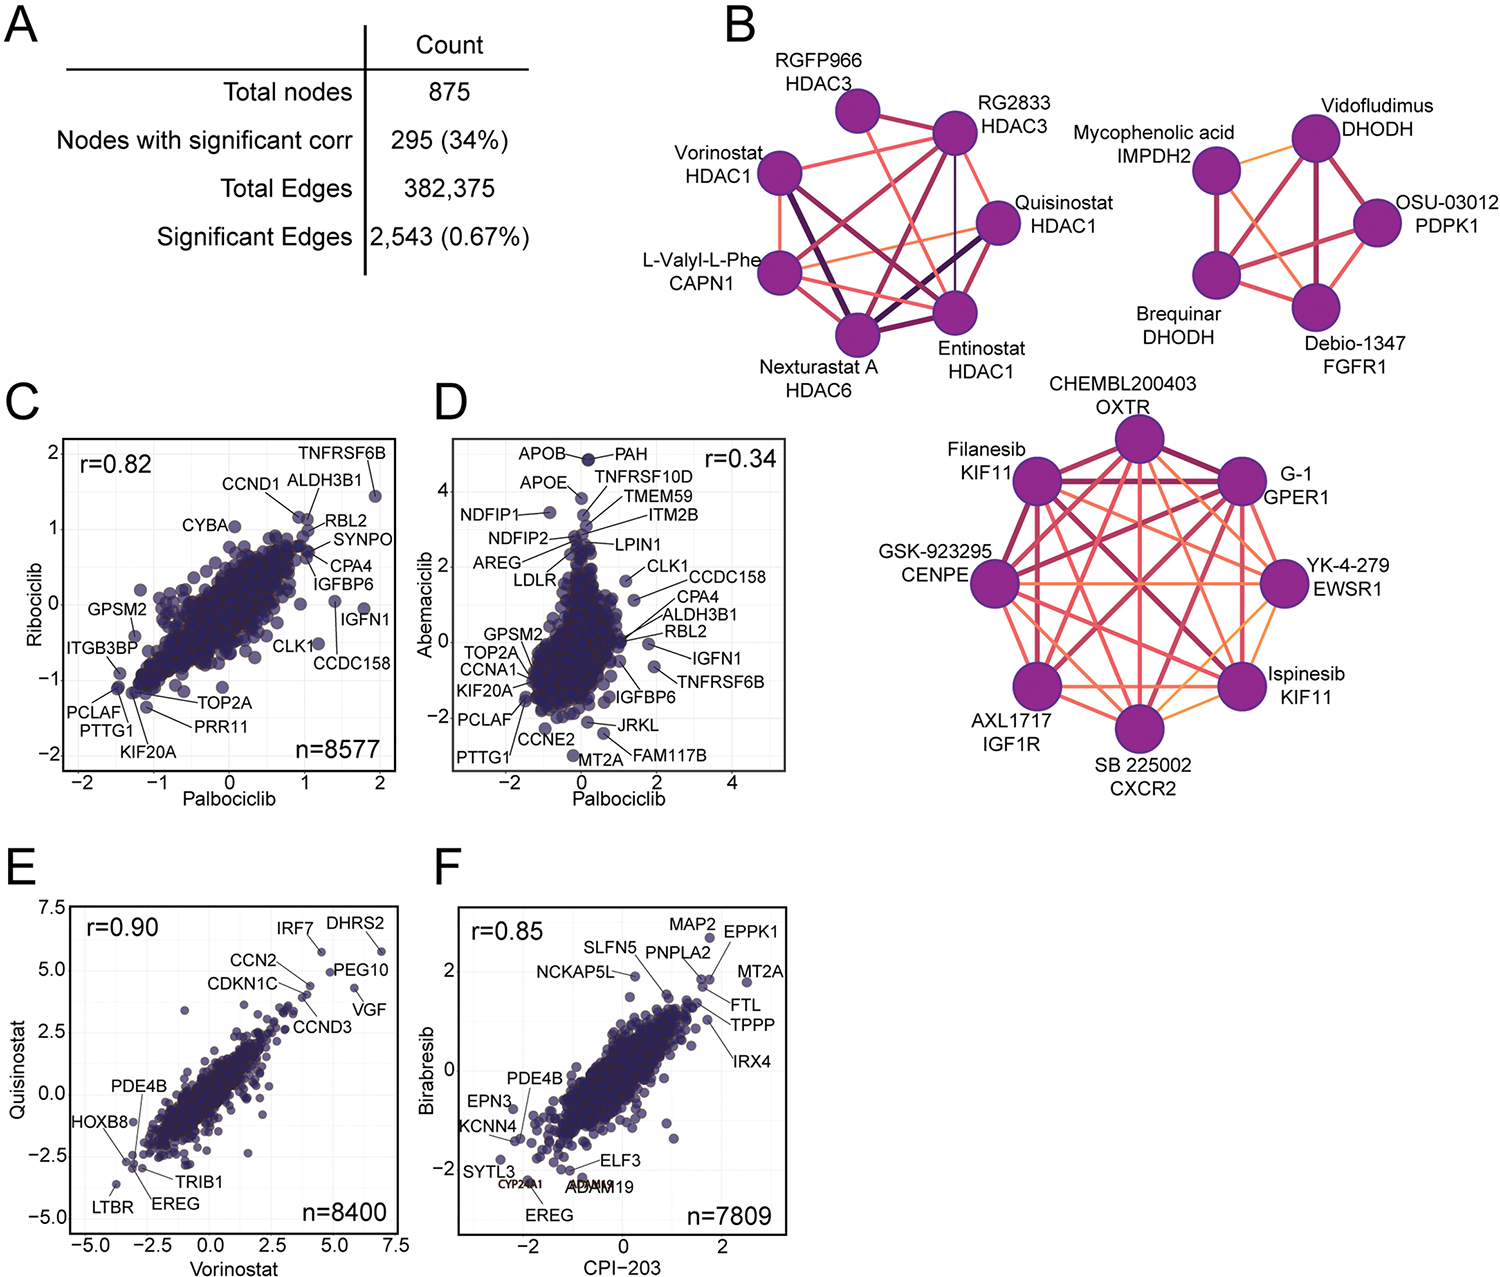
Extended Data Fig. 4 |. Compounds with a similar MOA are strongly correlated.

(a) A table highlighting the number of nodes and edges in the overall network from Fig. 4a, after filtering to a FDR of 0.1%. The percentage of nodes and edges included in the network out of the total possible is shown in parentheses. (b) Several subcommunities highlighted from the larger compound-compound correlation network, including a cluster of HDAC inhibitors. All subnetworks are filtered to only include edges with a Pearson r > 0.60. (c-f) Pairwise correlation plots of (c) the CDK4/6 inhibitors palbociclib and ribociclib, (d) the CDK4/6 inhibitors palbociclib and abemaciclib, (e) the HDAC inhibitors quisinostat and vorinostat, and (f) the BRD4 inhibitors birabresib and CPI-203. All x- and y-axes are represented as Log2 fold change (compound versus DMSO).
