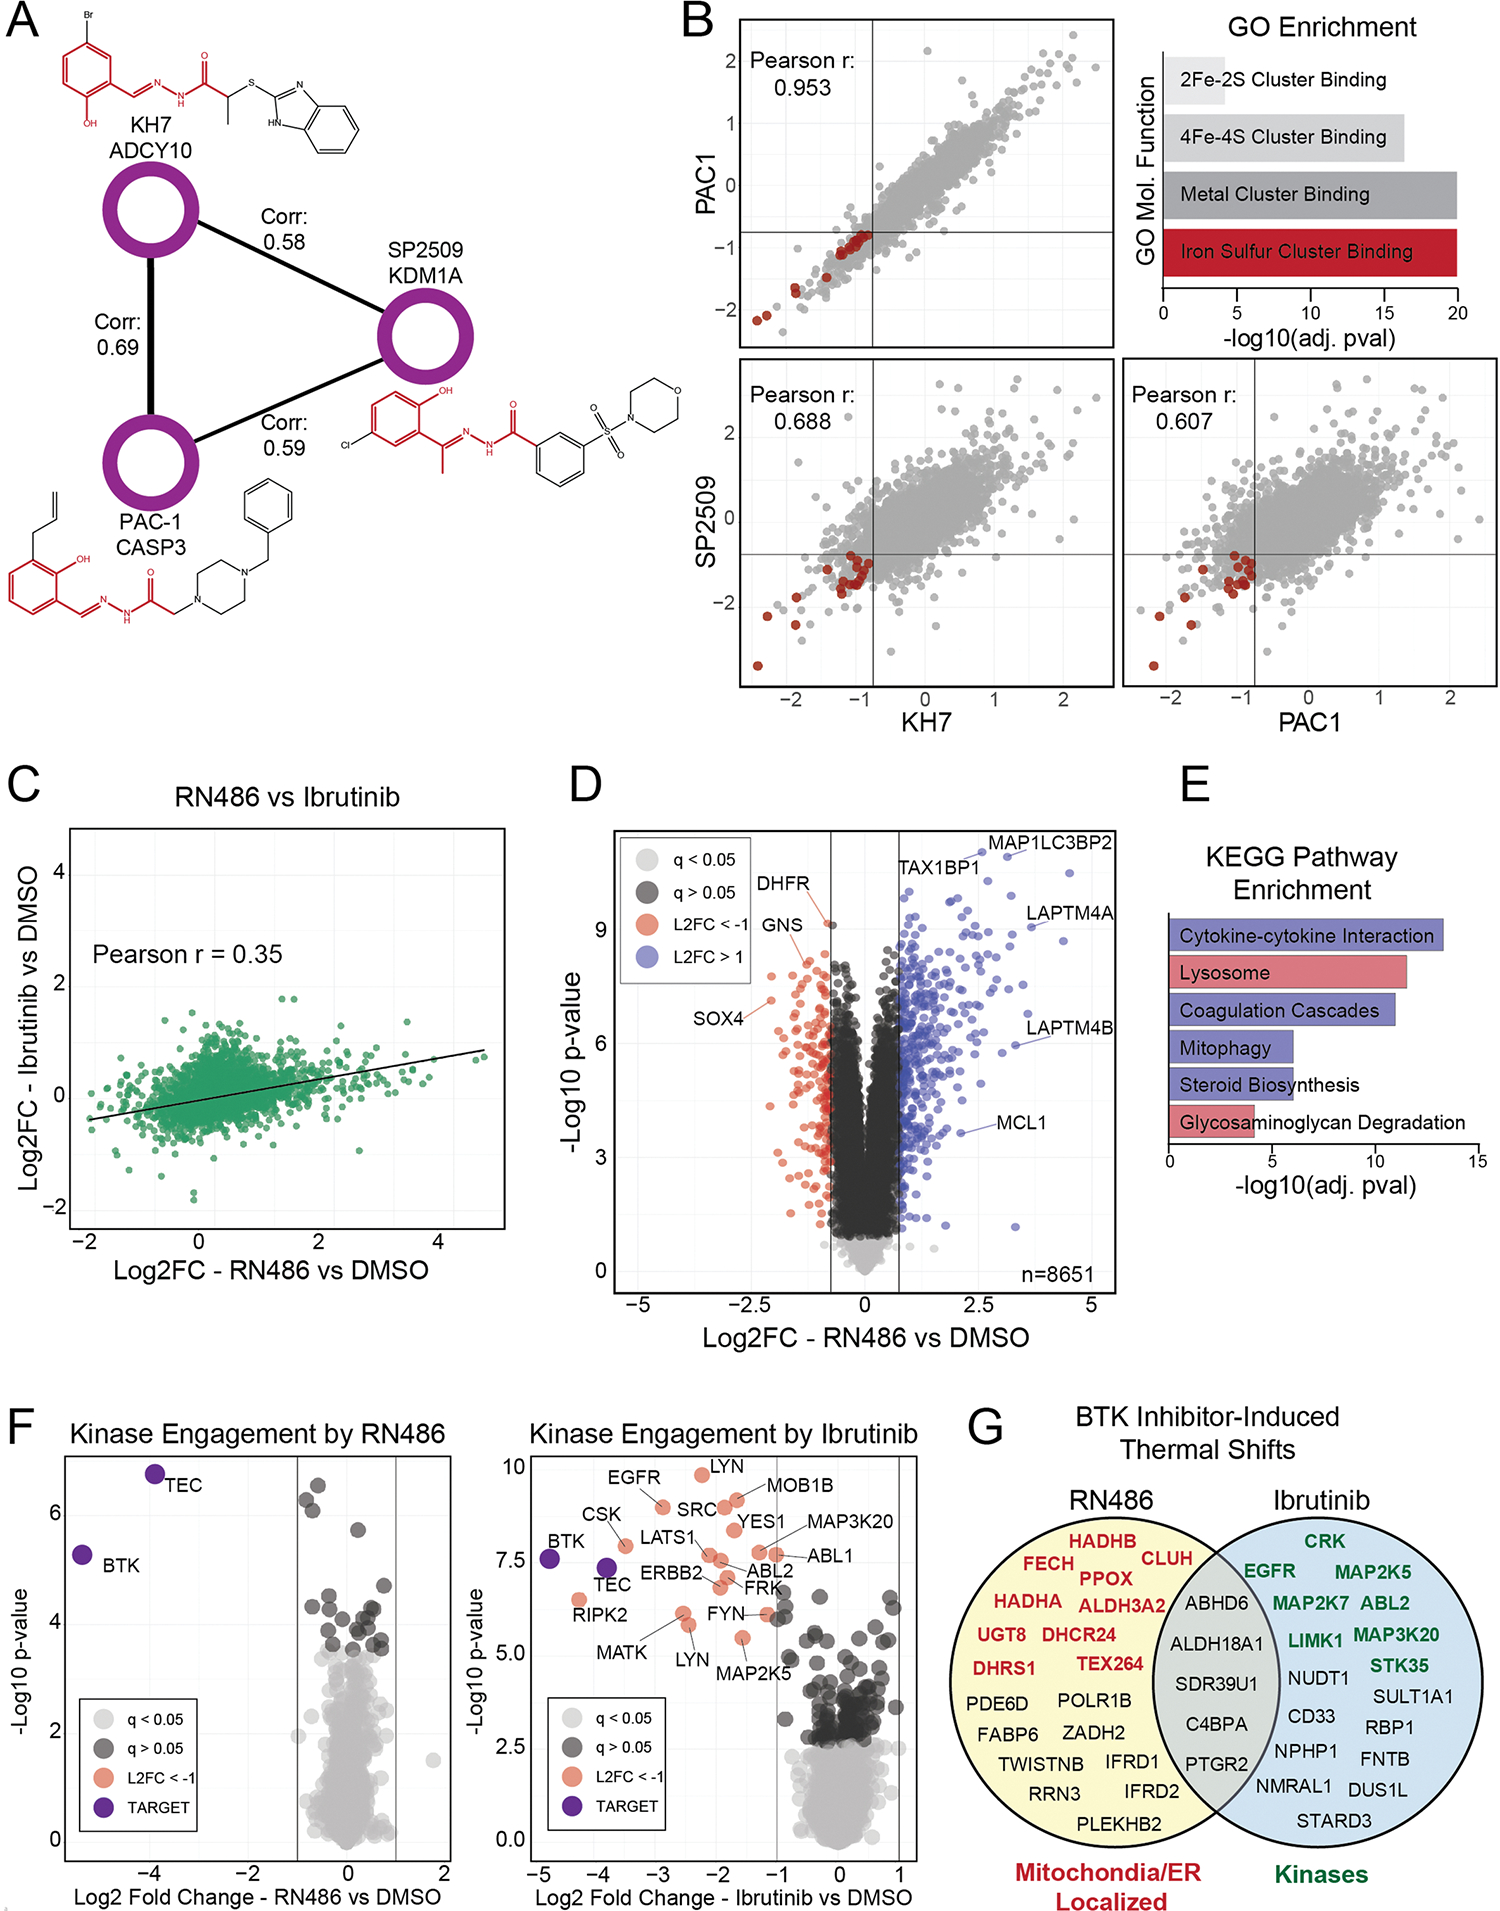
Extended Data Fig. 6 |. Novel activities and compound mechanisms can be inferred through compound-level correlation networks.

(a) An isolated community of three compounds with different targets and high correlation. Names, targets, and structures for each compound are shown. An aroylhydrazone group, common in all three compounds, is highlighted in red. (b) Correlation plots of the indicated compounds; repurchased and rescreened. All axes are Log2 fold change (compound versus DMSO). Lines are drawn at x = −0.75 and y = −0.75. GO enrichment of proteins decreased by ≥60% by all three compounds. Proteins from the ‘iron-sulfur cluster binding’ molecular function category are highlighted on the scatterplot in red. Enriched GO functions and their adjusted (using Benjamini-Hochberg) p-values were calculated using the enrichGO R package. (c) Correlation plot of repurchased RN486 (a noncovalent BTK inhibitor) and Ibrutinib (a covalent BTK inhibitor). (d) Volcano plot highlighting significantly up (blue) and down (red) regulated proteins in RN486 treated cells. ‘L2FC’ = Log2 fold change (RN486 vs DMSO) (e) KEGG pathway enrichment of up (blue bars) and down (red bars) regulated proteins in RN486 treated cells. Proteins used for KEGG pathway enrichment are color coded from (d). Enriched pathways and their adjusted (using Benjamini-Hochberg) p-values were calculated using the enrichKEGG R package. (f) Volcano plots of proteins competed off a kinase affinity enrichment medium (kinobeads) by RN486 (left) and Ibrutinib (right). A mixed lysate was used for this experiment, as BTK is not expressed in HCT116 cells. Compounds were tested at 10 μM, and all proteins with a two-fold or greater decrease in association with the enrichment matrix are labeled. BTK and TEC, the targets of these compounds, are highlighted in purple. ‘L2FC’ = Log2 fold change (treated vs DMSO) (g) Putative off targets of RN486 and Ibrutinib revealed by the proteome integral solubility alteration assay (PISA—a form of a thermal shift assay), performed in live HCT116 cells. Indicated proteins were significantly (5% FDR) stabilized or destabilized by treatment with one or both of the compounds (10 μM–30 min). All proteins with a Log2 fold change of >±0.25 are shown. Proteins localized to the mitochondria and/or endoplasmic reticulum are highlighted in red; kinases are highlighted in green. P-values in panels (d and f) were calculated for each protein within each treatment group relative to DMSO using a two-sided student’s t-test. False discovery rates (q-values) were estimated using the permutation-based method with 250 randomizations.
