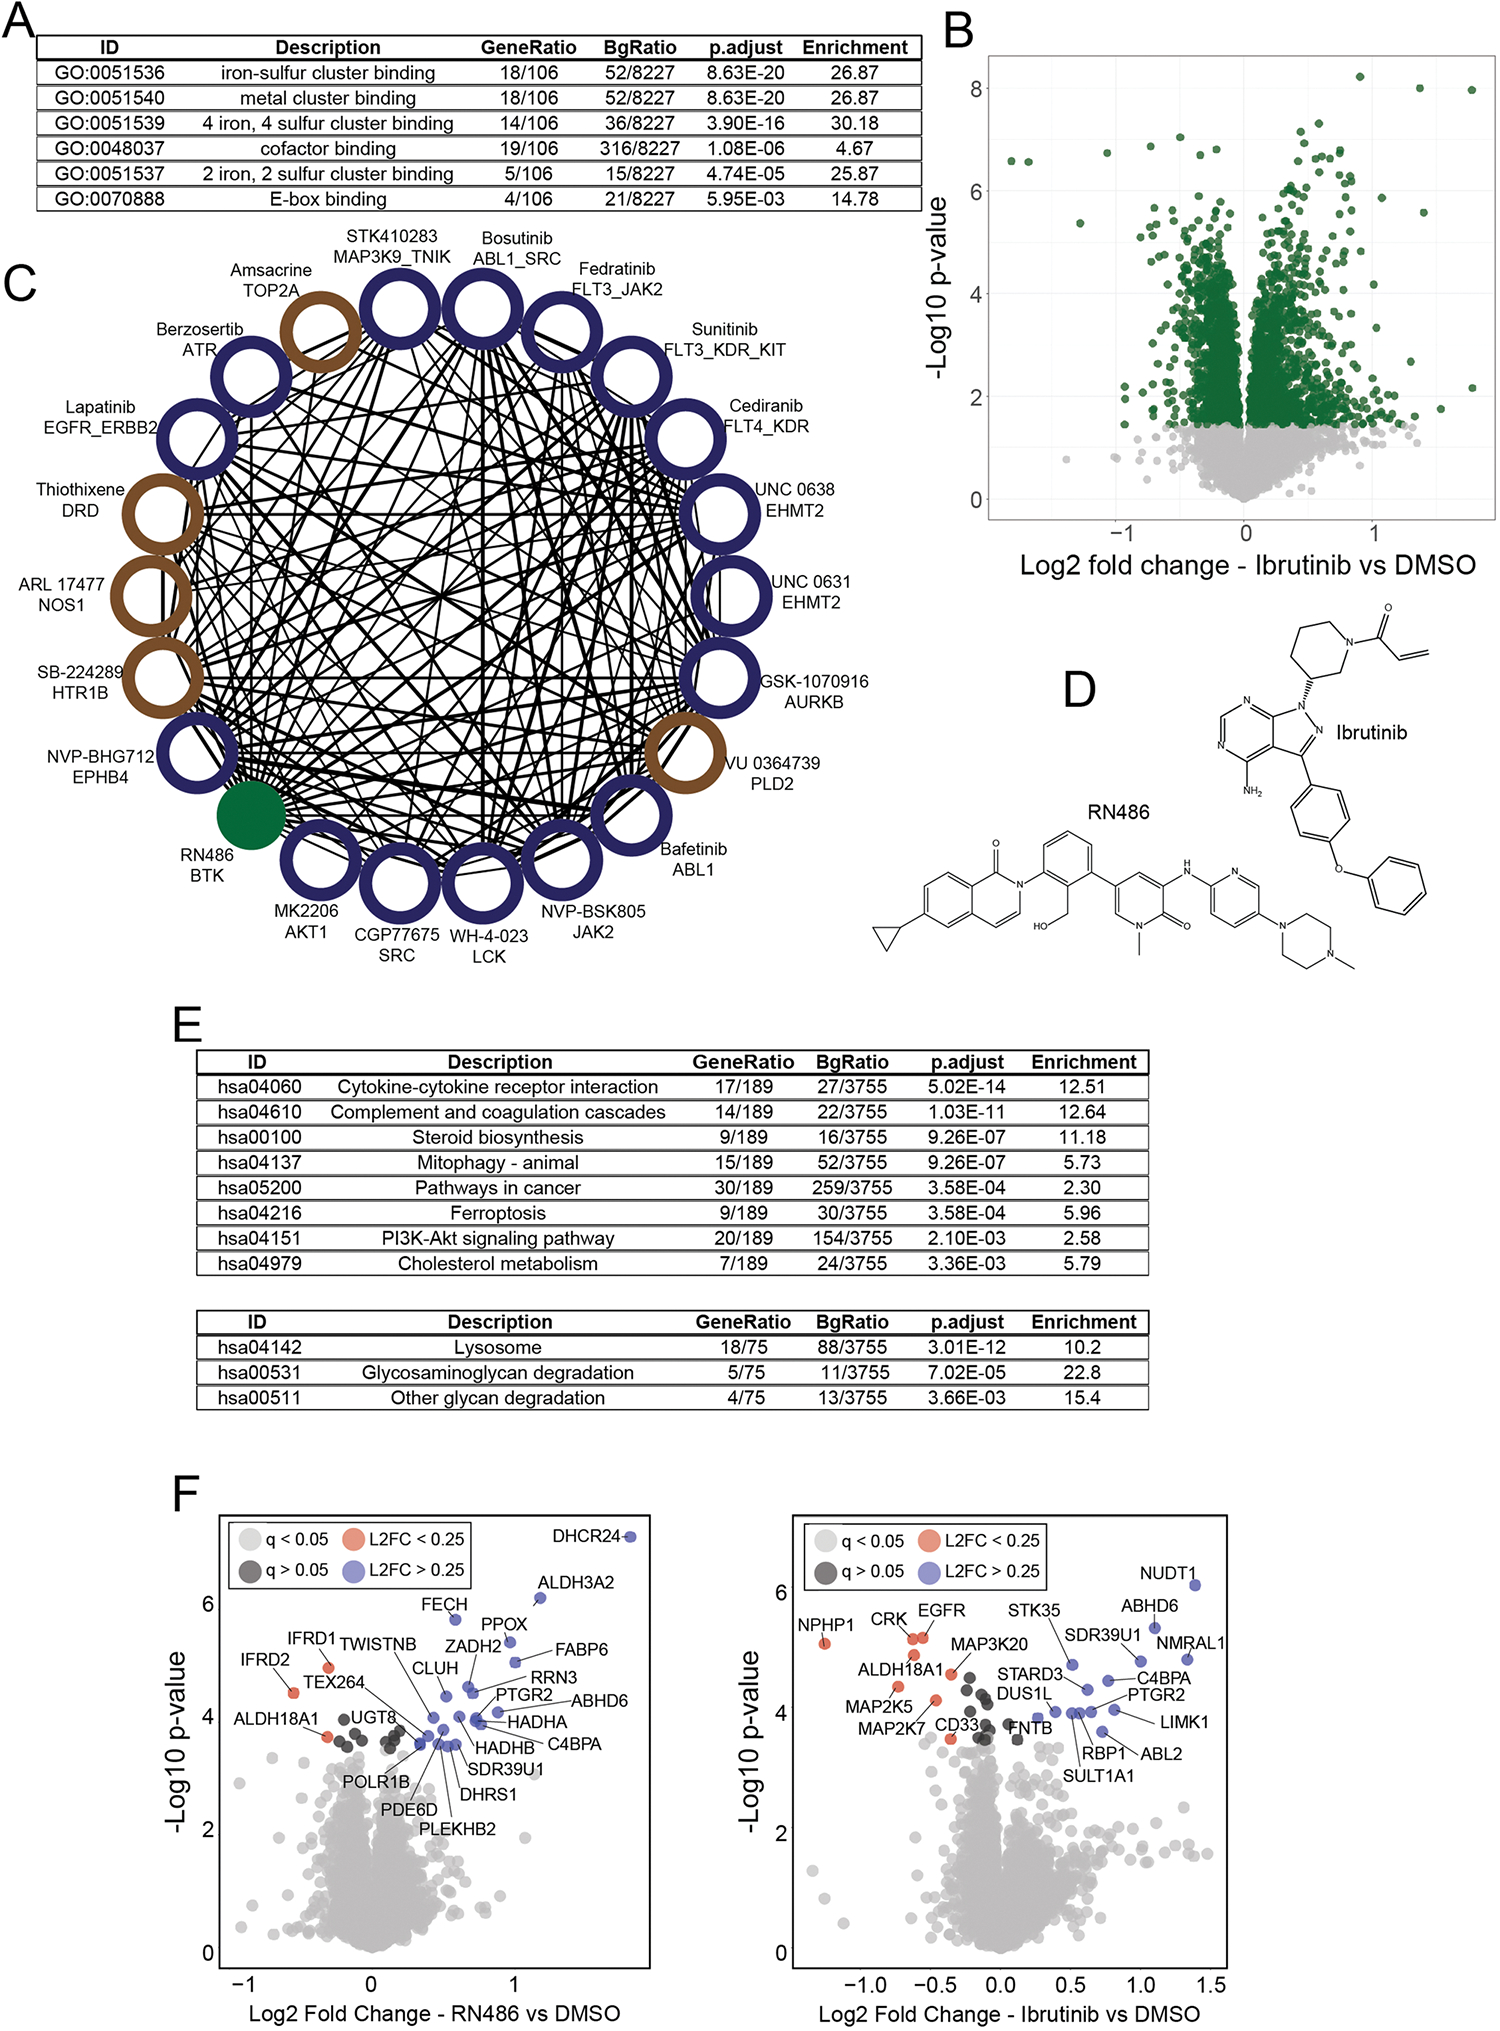
Extended Data Fig. 7 |. Novel activities and compound mechanisms can be inferred through compound-level correlation networks.

(a) Full table of GO enrichment results from Supplementary Fig. 6b. Enriched GO functions and their adjusted (using Benjamini-Hochberg) p-values were calculated using the enrichGO R package. (b) Volcano plot of protein expression from cells treated with (repurchased) ibrutinib for 24 hr at 10 μM. Green dots have q < 0.05 by permutation-based FDR. (c) Compound-compound community of RN486 correlated compounds (Pearson > 0.5). Blue nodes are kinase inhibitors, brown nodes are annotated to target other classes of proteins. The RN486 node is green. (d) Chemical structures of RN486 and Ibrutinib. (e) Full tables of KEGG pathway enrichment related to Supplementary Fig. 6E. Pathways enriched from upregulated proteins (top) and down-regulated proteins (bottom) are shown. Enriched pathways and their adjusted (using Benjamini-Hochberg) p-values were calculated using the enrichKEGG R package. (f) Volcano plot showing results of the thermal shift assay (PISA experiment) from HCT116 cells treated with Ibrutinib (left) or RN486 (right). Compounds were treated at 10 μM for 30 minutes in suspension. All proteins (with q < 0.05) with Log2FC greater than 0.25 or less than −0.25 are included in Fig. 6g. ‘L2FC’ = Log2 fold change (treated vs DMSO). P-values in panels (b and f) were calculated for each protein within each treatment group relative to DMSO using a two-sided student’s t-test. False discovery rates (q-values) were estimated using the permutation-based method with 250 randomizations.
