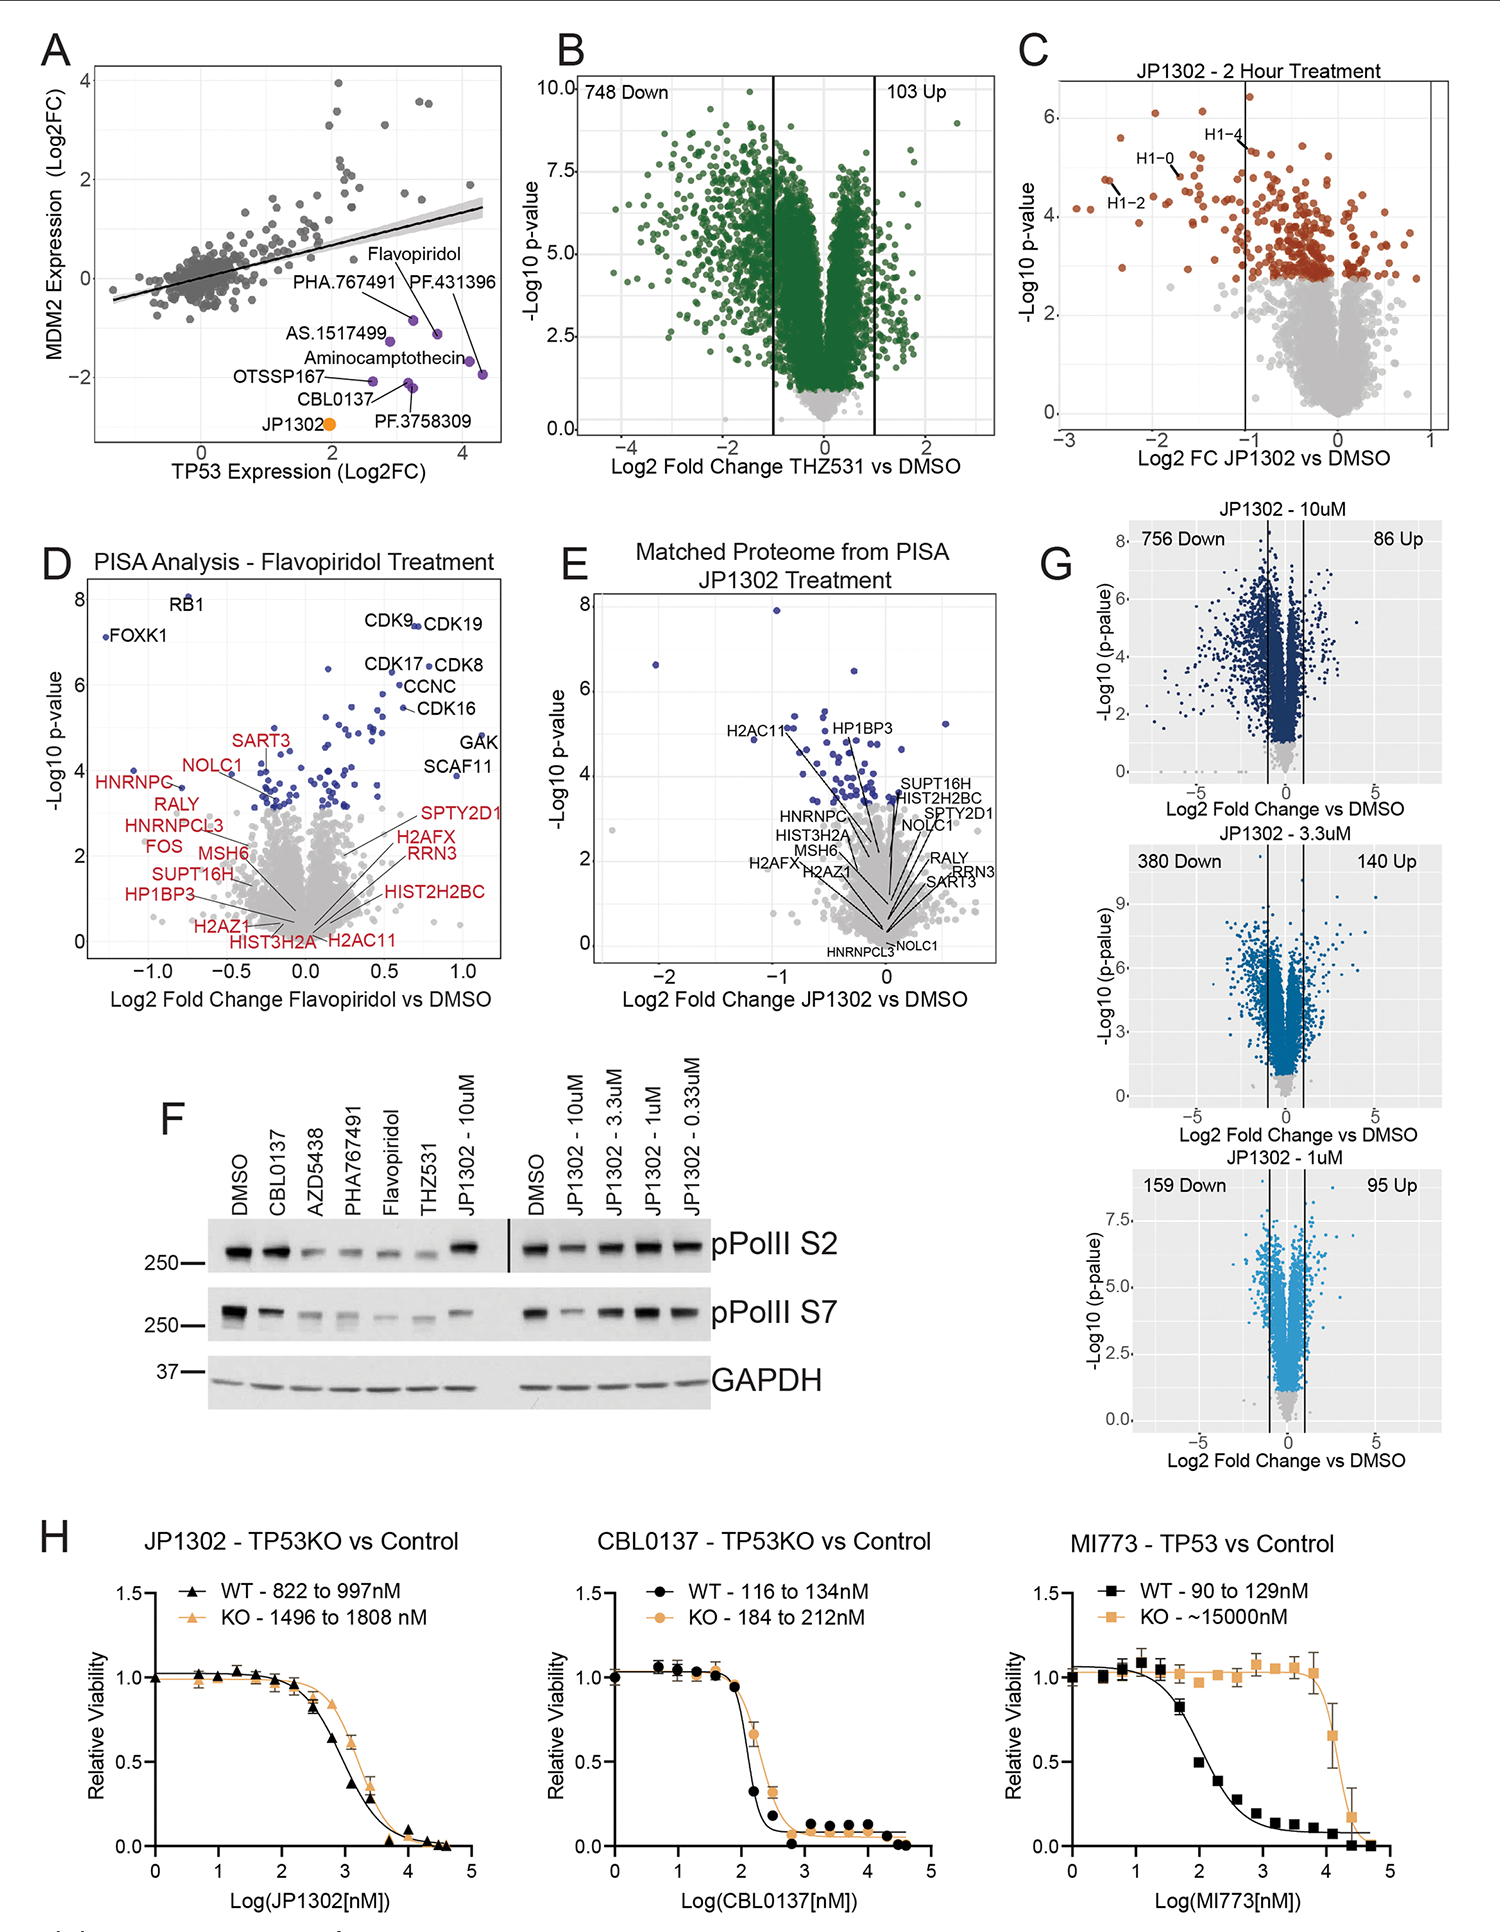
Extended Data Fig. 8 |. JP1302 stops transcription by disrupting the FACT complex and histone H1.

(a) Protein-level linear regression of TP53 and the TP53 response gene MDM2 for all compounds in the dataset. Compounds that break the expected trend are shown (purple), including JP1302 (orange). Shading along the regression line represents the 95% confidence interval. (b) Volcano plot of protein expression from HCT116 cells treated with 1 μM THZ531 for 24 hr. (c) Volcano plot of protein expression from HCT116 cells treated with repurchased JP1302 (10 μM) for 2 hr. (d) Volcano plot showing results from a PISA experiment from cells treated with flavopiridol (10 μM). Red labels correspond to the same proteins labeled in the CBL0137/JP1302 PISA experiment in Fig. 6h. Black text highlights proteins with melting temperatures uniquely affected by flavopiridol. (e) Volcano plot of protein expression from HCT116 cells treated with repurchased JP1302 for 30 min (10 μM), prior to being subjected to melting for PISA analysis. This is a matched proteome for Fig. 6h; the same proteins are labeled to show ligand-induced changes in thermal stability are not due to protein-level changes. (f) Western blot of RNA polymerase II phosphorylation levels in HCT116 cells treated for 90 minutes with indicated compounds. Treatment concentration is 10 μM or 1 μM (THZ531) unless indicated. The ‘pPolII S2’ panel is made from two separate Western blots, as indicated by the black vertical line. This experiment was performed twice, on different days, achieving similar results. (g) Volcano plots from the dose-dependent JP1302 whole proteome experiment. Noted in each plot is the number of proteins decreased by two-fold versus DMSO (left side) and increased two-fold versus DMSO (right side). (h) Full 16-point EC50 curves for the indicated compounds in HCT116 cells with wild-type (WT) TP53 or after TP53 knockout (KO). Labeled in each plot is the 95% confidence interval for each EC50 curve. Points on each curve are presented as the mean values ± standard deviation of biological triplicate measurements. MI773 is a nutlin-based, MDM2-P53 protein-protein interaction inhibitor. P-values in panels (B-E and G) were calculated for each protein within each treatment group relative to DMSO using a two-sided student’s t-test. False discovery rates (q-values) were estimated using the permutation-based method with 250 randomizations. Proteins with q > 0.05 are represented by light grey in each plot.
